29
/it/
it
AIzaSyAYiBZKx7MnpbEhh9jyipgxe19OcubqV5w
April 1, 2024
89561
Botswana
BWA
true
2
1
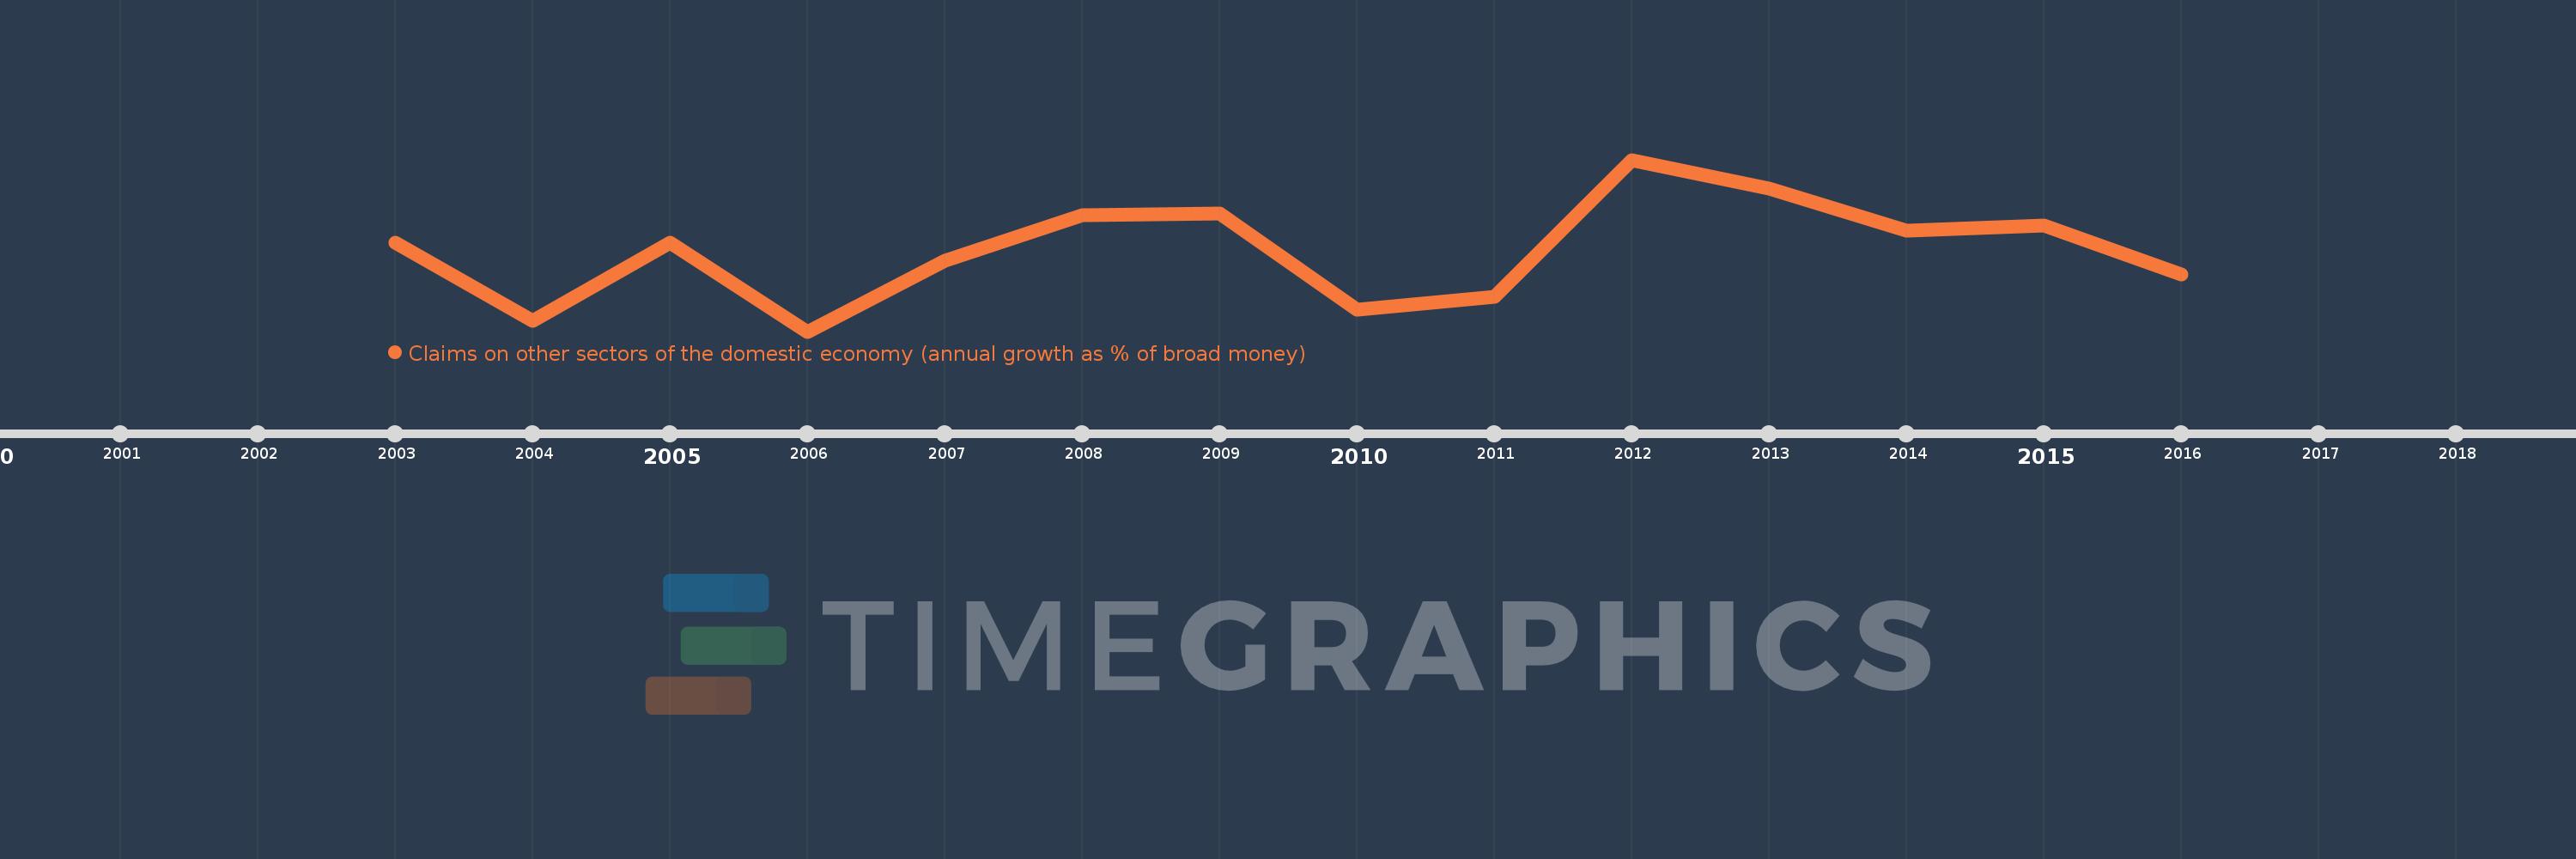
Claims on other sectors of the domestic economy (annual growth as % of broad money)
2016,2015,2014,2013,2012,2011,2010,2009,2008,2007,2006,2005,2004,2003
Queste statistiche in altri paesi:
Linea del tempo:
Questa scala temporale mostra un grafico dal 2003 anno al 2016 anno. Botswana. I dati fino ad 2002 anno non disponibili. Il numero di osservazioni attuali secondo i date: 14.
La fonte (nome):
Indicatori dello sviluppo mondiale
La fonte (organizzazione):
International Monetary Fund, International Financial Statistics and data files.
Categorie:
Financial Sector
sono stati aggiornati
23 apr 2017 anni
Indicatori delle variazioni dei valori per anni
Minima:
3.661
1 gen 2006 anni
Massimo:
16.536
1 gen 2012 anni
Alla data di osservazione
Valore
Variazione assoluta
La variazione rispetto al valore precedente
1 gen 2003 anni
10.337
+10.337
0.0%
1 gen 2004 anni
4.466
-5.87
-56.79%
1 gen 2005 anni
10.334
+5.868
131.38%
1 gen 2006 anni
3.661
-6.673
-64.57%
1 gen 2007 anni
8.974
+5.313
145.11%
1 gen 2008 anni
12.382
+3.408
37.98%
1 gen 2009 anni
12.531
+0.149
1.2%
1 gen 2010 anni
5.325
-7.206
-57.5%
1 gen 2011 anni
6.288
+0.963
18.08%
1 gen 2012 anni
16.536
+10.248
162.97%
1 gen 2013 anni
14.411
-2.125
-12.85%
1 gen 2014 anni
11.213
-3.198
-22.19%
1 gen 2015 anni
11.582
+0.369
3.29%
1 gen 2016 anni
7.918
-3.664
-31.63%
Classificazione dei paesi secondo i statistiche attuali per anni


Commenti: