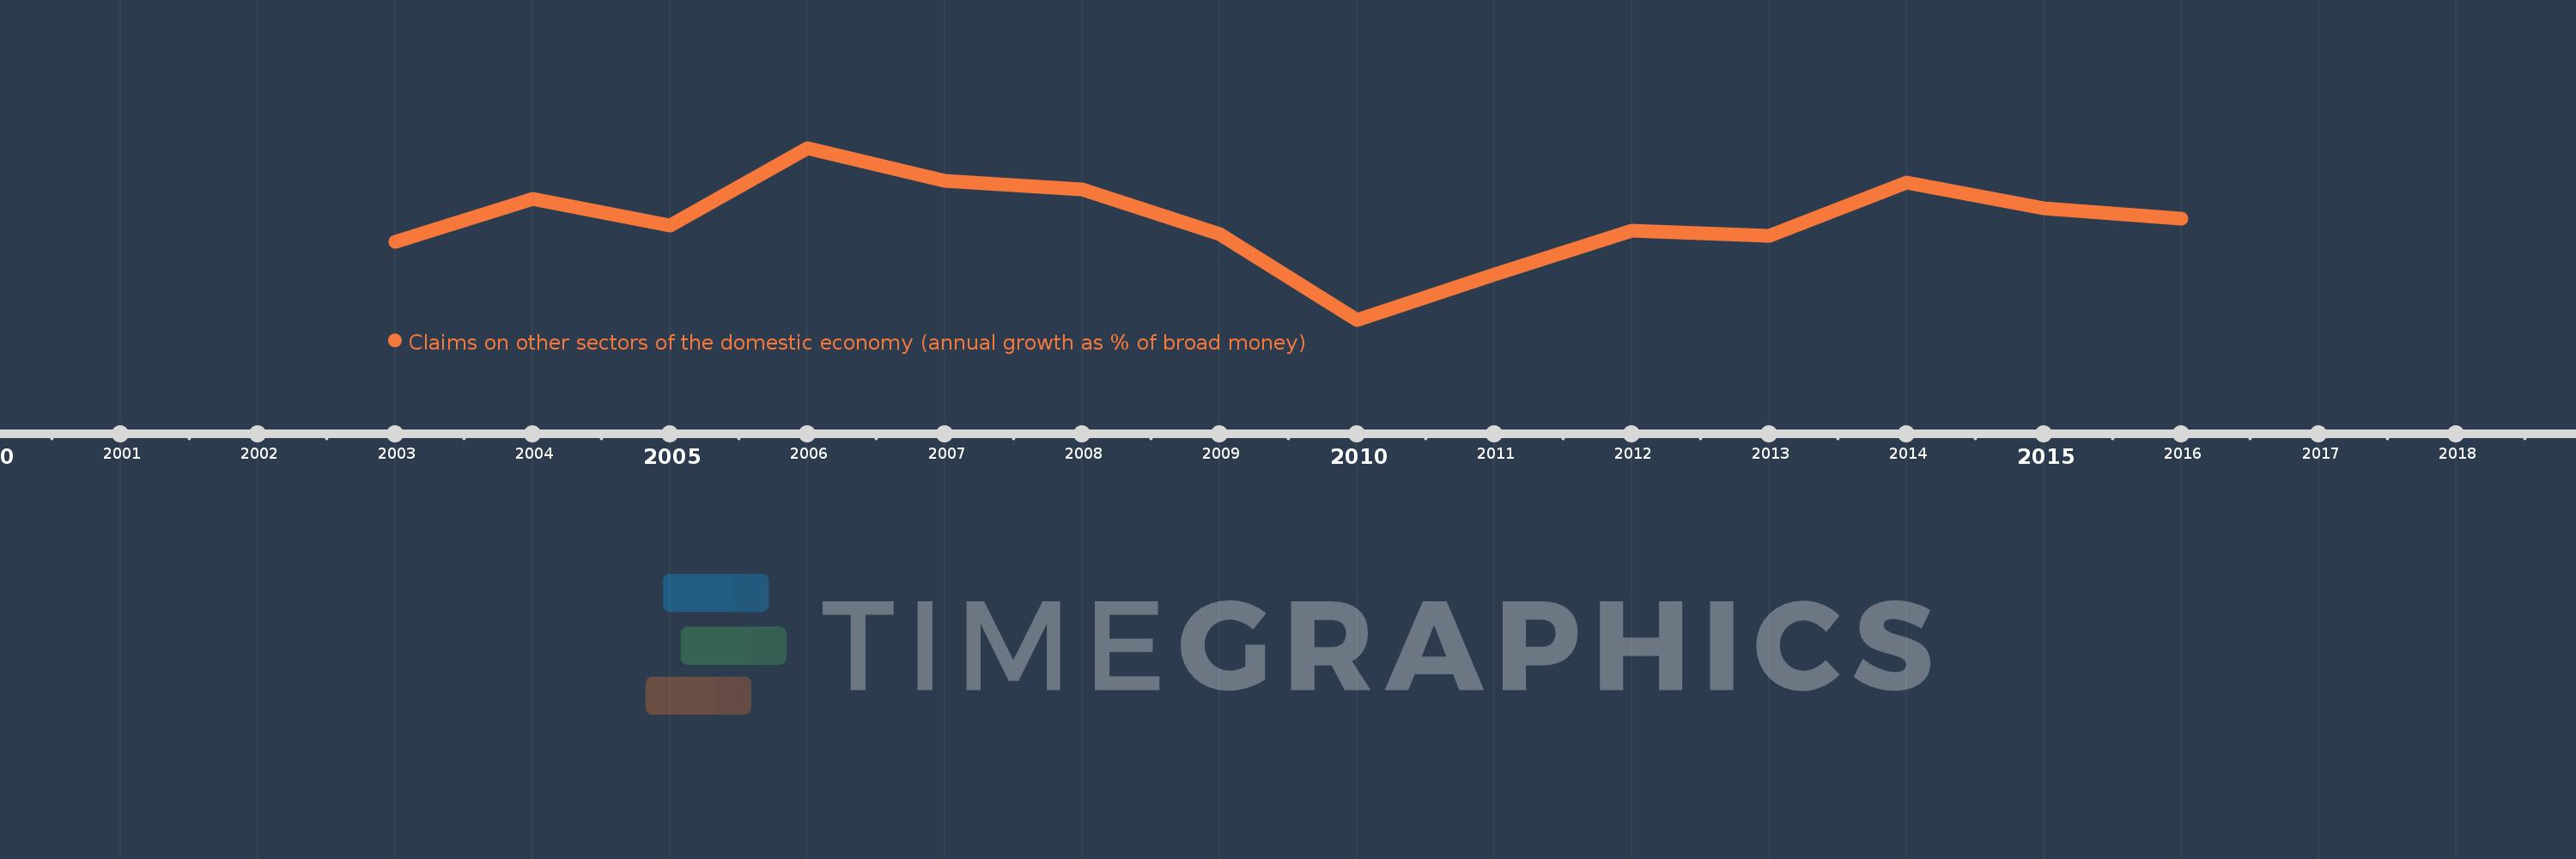
Questa scala temporale mostra un grafico dal 2003 anno al 2016 anno. El Salvador. I dati fino ad 2002 anno non disponibili. Il numero di osservazioni attuali secondo i date: 14.
La fonte (nome):
Indicatori dello sviluppo mondiale
La fonte (organizzazione):
International Monetary Fund, International Financial Statistics and data files.
Categorie:
Financial Sector
sono stati aggiornati
23 apr 2017 anni
Indicatori delle variazioni dei valori per anni
In media:
4.239
Minima:
-4.26
1 gen 2010 anni
Massimo:
10.476
1 gen 2006 anni
Alla data di osservazione
Valore
Variazione assoluta
La variazione rispetto al valore precedente
1 gen 2003 anni
2.425
+2.425
0.0%
1 gen 2004 anni
6.13
+3.705
152.75%
1 gen 2005 anni
3.817
-2.313
-37.73%
1 gen 2006 anni
10.476
+6.658
174.43%
1 gen 2007 anni
7.63
-2.846
-27.17%
1 gen 2008 anni
6.936
-0.694
-9.1%
1 gen 2009 anni
3.062
-3.874
-55.85%
1 gen 2010 anni
-4.26
-7.322
-239.13%
1 gen 2011 anni
-0.38
+3.88
-91.08%
1 gen 2012 anni
3.379
+3.758
-989.53%
1 gen 2013 anni
2.962
-0.416
-12.32%
1 gen 2014 anni
7.481
+4.519
152.54%
1 gen 2015 anni
5.293
-2.188
-29.24%
1 gen 2016 anni
4.393
-0.9
-17.01%
Classificazione dei paesi secondo i statistiche attuali per anni
