29
/it/
it
AIzaSyAYiBZKx7MnpbEhh9jyipgxe19OcubqV5w
April 1, 2024
153097
Hungary
HUN
true
2
1
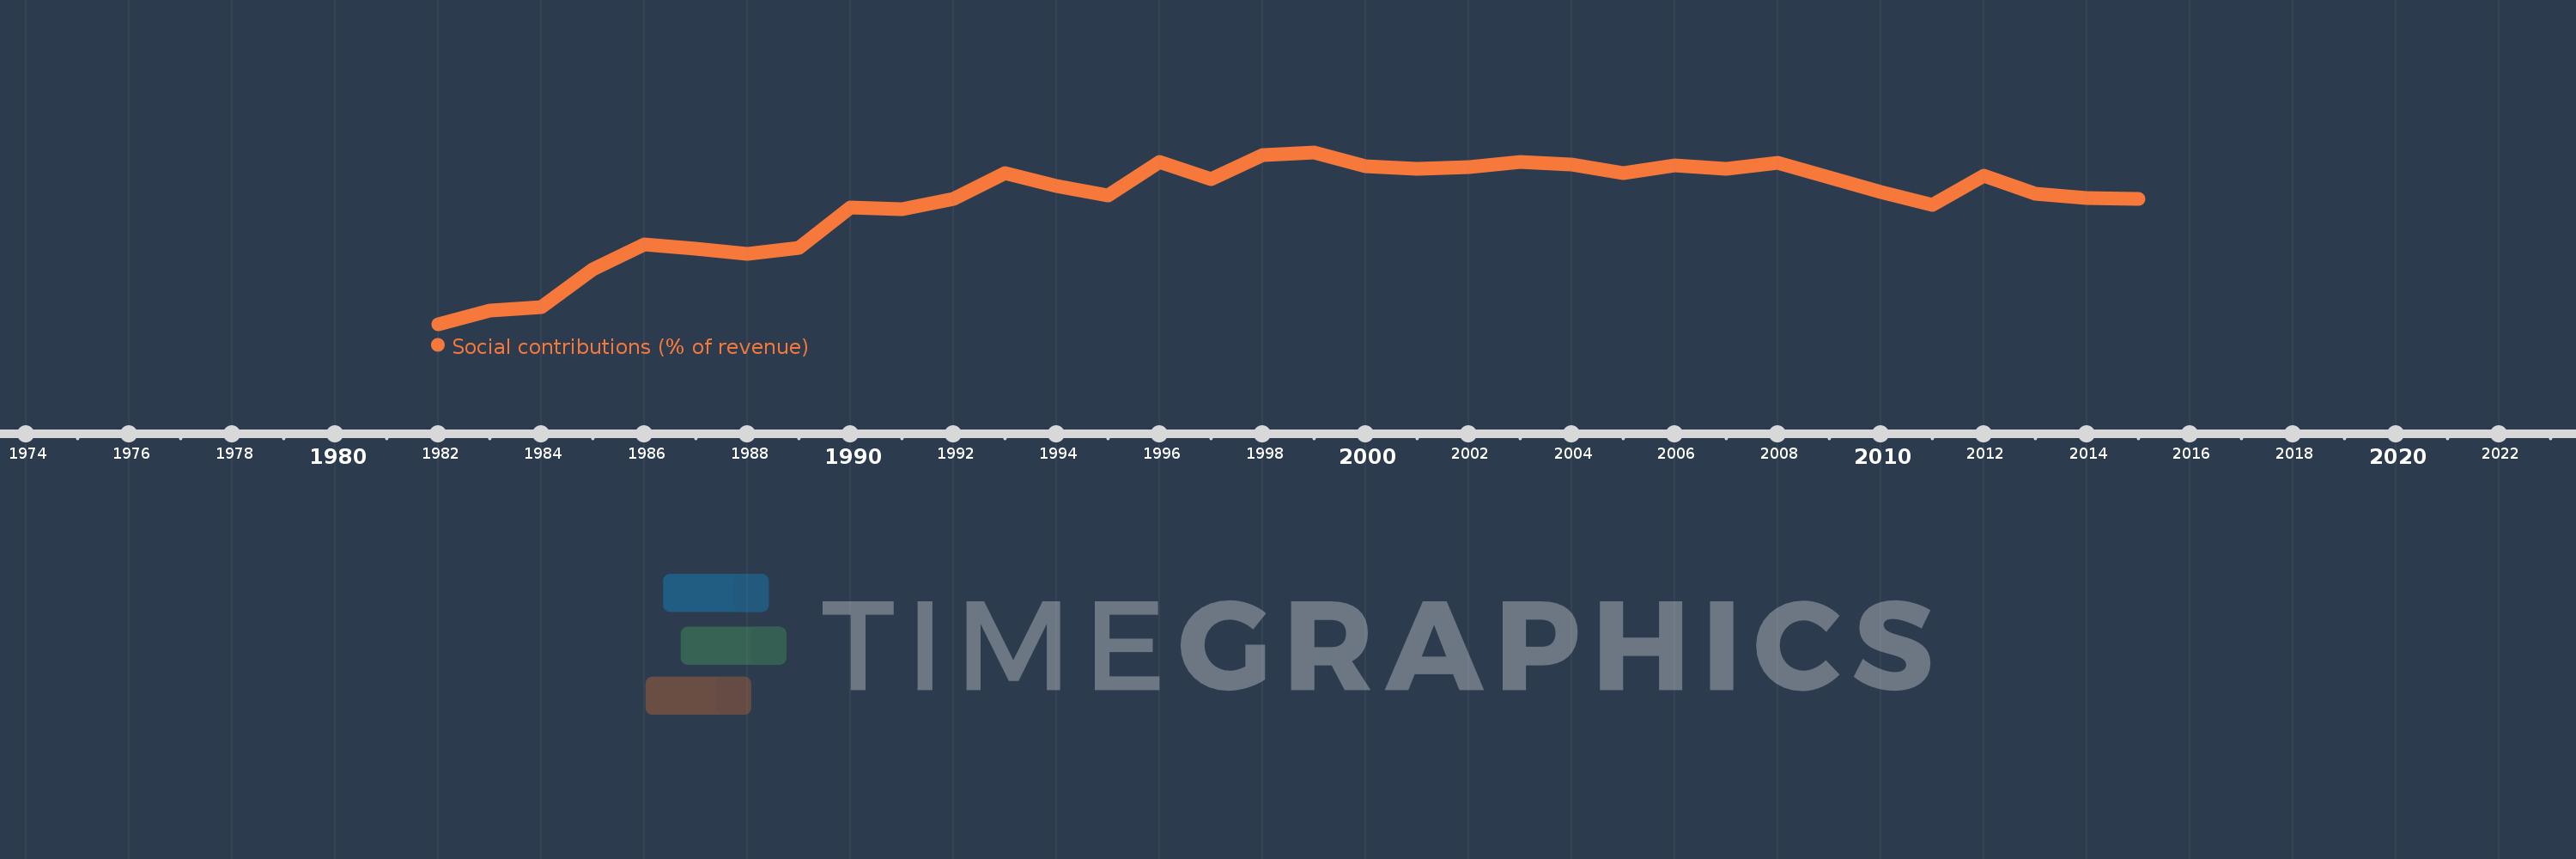
Social contributions (% of revenue)
2015,2014,2013,2012,2011,2010,2009,2008,2007,2006,2005,2004,2003,2002,2001,2000,1999,1998,1997,1996,1995,1994,1993,1992,1991,1990,1989,1988,1987,1986,1985,1984,1983,1982
Queste statistiche in altri paesi:
Linea del tempo:
Questa scala temporale mostra un grafico dal 1982 anno al 2015 anno. Hungary. I dati fino ad 1981 anno non disponibili. Il numero di osservazioni attuali secondo i date: 34.
La fonte (nome):
Indicatori dello sviluppo mondiale
La fonte (organizzazione):
International Monetary Fund, Government Finance Statistics Yearbook and data files.
Categorie:
Public Sector
sono stati aggiornati
23 apr 2017 anni
Indicatori delle variazioni dei valori per anni
Minima:
15.307
1 gen 1982 anni
Massimo:
36.048
1 gen 1999 anni
Alla data di osservazione
Valore
Variazione assoluta
La variazione rispetto al valore precedente
1 gen 1982 anni
15.307
+15.307
0.0%
1 gen 1983 anni
16.982
+1.675
10.94%
1 gen 1984 anni
17.379
+0.397
2.34%
1 gen 1985 anni
21.917
+4.538
26.11%
1 gen 1986 anni
24.93
+3.013
13.75%
1 gen 1987 anni
24.473
-0.458
-1.84%
1 gen 1988 anni
23.849
-0.623
-2.55%
1 gen 1989 anni
24.497
+0.648
2.72%
1 gen 1990 anni
29.381
+4.884
19.94%
1 gen 1991 anni
29.225
-0.155
-0.53%
1 gen 1992 anni
30.408
+1.183
4.05%
1 gen 1993 anni
33.542
+3.134
10.31%
1 gen 1994 anni
32.001
-1.541
-4.59%
1 gen 1995 anni
30.874
-1.127
-3.52%
1 gen 1996 anni
34.861
+3.987
12.91%
1 gen 1997 anni
32.834
-2.027
-5.81%
1 gen 1998 anni
35.732
+2.899
8.83%
1 gen 1999 anni
36.048
+0.316
0.88%
1 gen 2000 anni
34.381
-1.667
-4.62%
1 gen 2001 anni
34.03
-0.351
-1.02%
1 gen 2002 anni
34.261
+0.231
0.68%
1 gen 2003 anni
34.88
+0.62
1.81%
1 gen 2004 anni
34.562
-0.318
-0.91%
1 gen 2005 anni
33.598
-0.964
-2.79%
1 gen 2006 anni
34.494
+0.895
2.66%
1 gen 2007 anni
34.106
-0.388
-1.12%
1 gen 2008 anni
34.779
+0.674
1.98%
1 gen 2009 anni
33.049
-1.73
-4.98%
1 gen 2010 anni
31.302
-1.747
-5.29%
1 gen 2011 anni
29.74
-1.562
-4.99%
1 gen 2012 anni
33.231
+3.491
11.74%
1 gen 2013 anni
31.032
-2.199
-6.62%
1 gen 2014 anni
30.567
-0.465
-1.5%
1 gen 2015 anni
30.417
-0.15
-0.49%
Classificazione dei paesi secondo i statistiche attuali per anni


Commenti: