29
/it/
it
AIzaSyAYiBZKx7MnpbEhh9jyipgxe19OcubqV5w
April 1, 2024
263006
Thailand
THA
true
2
1
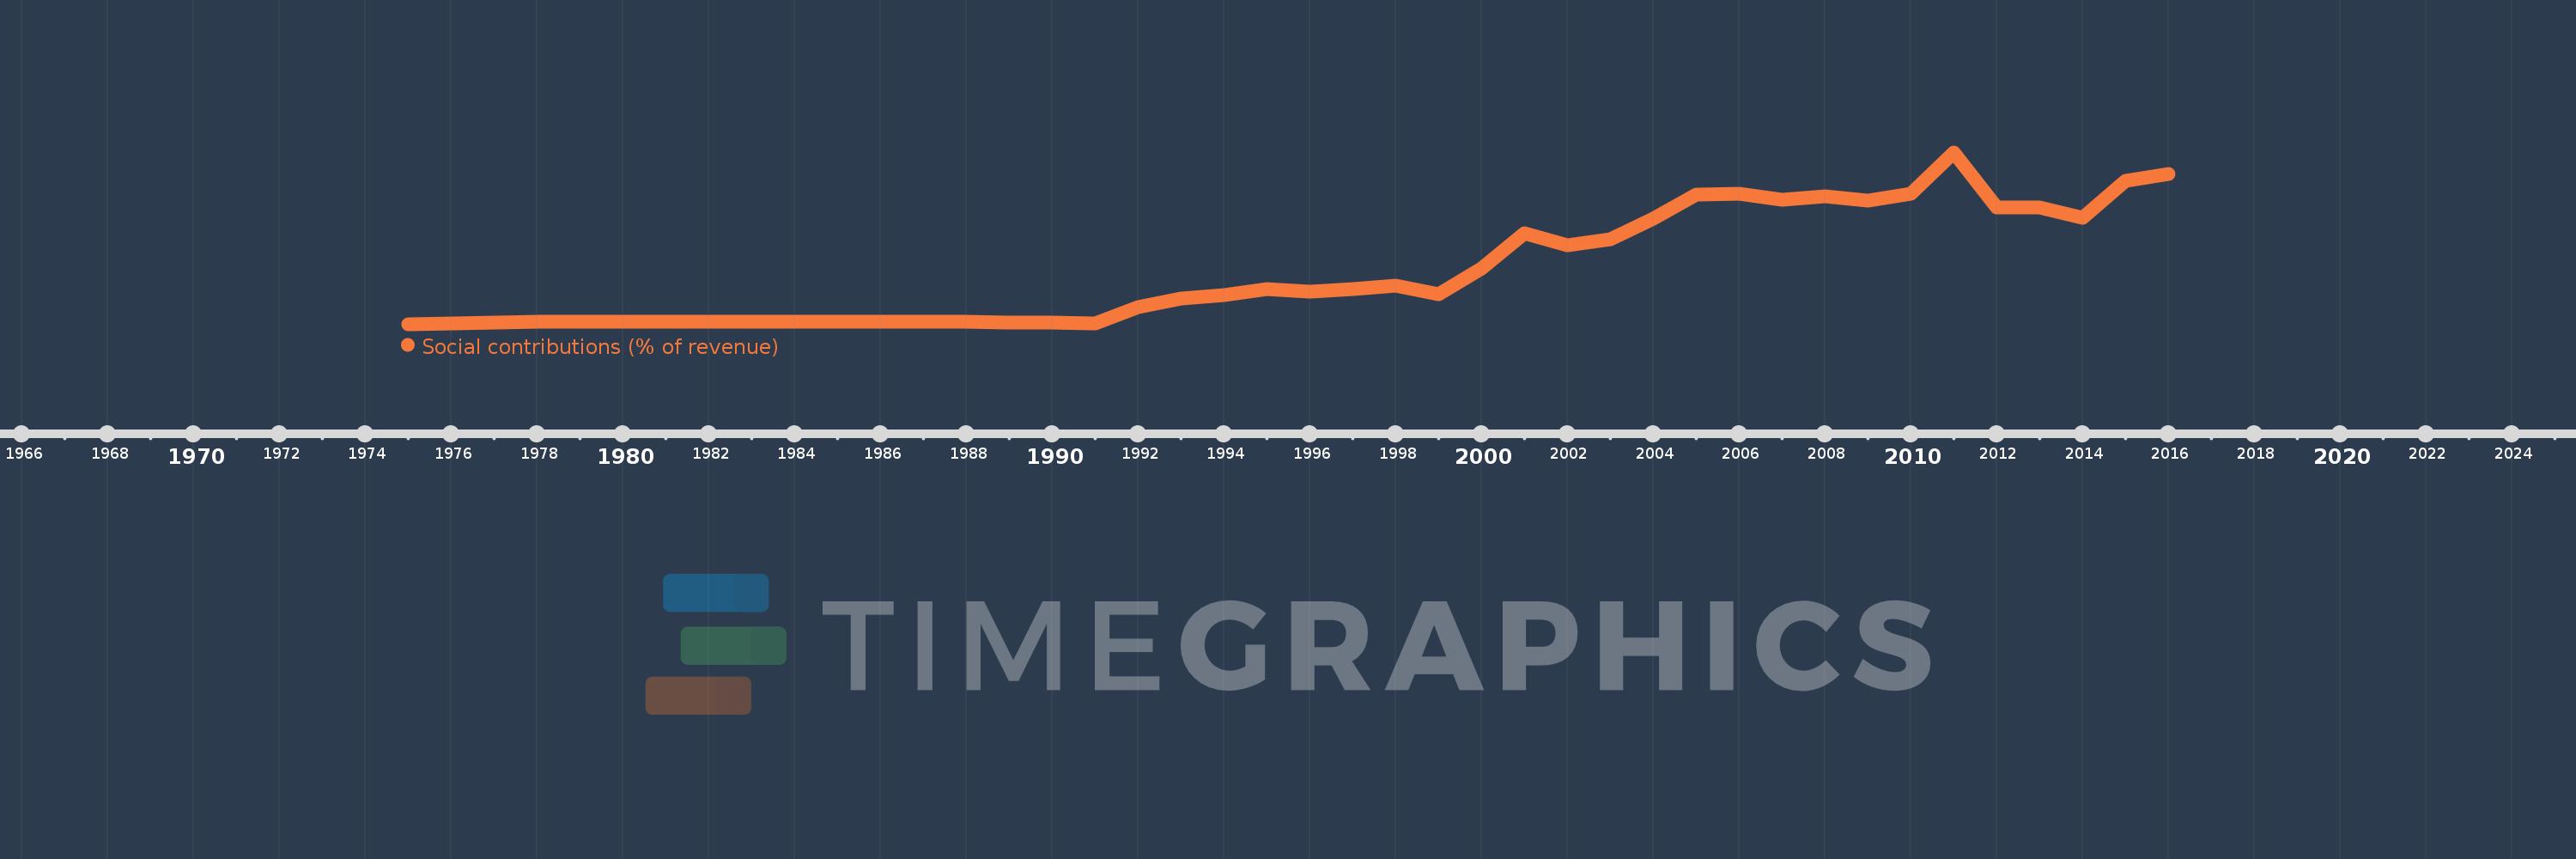
Social contributions (% of revenue)
2016,2015,2014,2013,2012,2011,2010,2009,2008,2007,2006,2005,2004,2003,2002,2001,2000,1999,1998,1997,1996,1995,1994,1993,1992,1991,1990,1989,1988,1987,1986,1985,1984,1983,1982,1981,1980,1979,1978,1977,1976,1975
Queste statistiche in altri paesi:
Linea del tempo:
Questa scala temporale mostra un grafico dal 1975 anno al 2016 anno. Thailand. I dati fino ad 1974 anno non disponibili. Il numero di osservazioni attuali secondo i date: 42.
La fonte (nome):
Indicatori dello sviluppo mondiale
La fonte (organizzazione):
International Monetary Fund, Government Finance Statistics Yearbook and data files.
Categorie:
Public Sector
sono stati aggiornati
23 apr 2017 anni
Indicatori delle variazioni dei valori per anni
Minima:
0.064
1 gen 1975 anni
Massimo:
6.441
1 gen 2011 anni
Alla data di osservazione
Valore
Variazione assoluta
La variazione rispetto al valore precedente
1 gen 1975 anni
0.064
+0.064
0.0%
1 gen 1976 anni
0.09
+0.027
41.78%
1 gen 1977 anni
0.127
+0.037
41.33%
1 gen 1978 anni
0.144
+0.016
12.95%
1 gen 1979 anni
0.144
+0.0
0.01%
1 gen 1980 anni
0.148
+0.005
3.24%
1 gen 1981 anni
0.157
+0.008
5.71%
1 gen 1982 anni
0.159
+0.002
1.41%
1 gen 1983 anni
0.169
+0.01
6.05%
1 gen 1984 anni
0.153
-0.015
-9.16%
1 gen 1985 anni
0.158
+0.005
3.21%
1 gen 1986 anni
0.161
+0.002
1.56%
1 gen 1987 anni
0.16
0.0
-0.21%
1 gen 1988 anni
0.149
-0.011
-6.98%
1 gen 1989 anni
0.129
-0.02
-13.19%
1 gen 1990 anni
0.122
-0.008
-5.89%
1 gen 1991 anni
0.107
-0.015
-11.95%
1 gen 1992 anni
0.709
+0.602
561.04%
1 gen 1993 anni
1.022
+0.313
44.14%
1 gen 1994 anni
1.13
+0.108
10.59%
1 gen 1995 anni
1.381
+0.251
22.22%
1 gen 1996 anni
1.262
-0.12
-8.68%
1 gen 1997 anni
1.369
+0.107
8.52%
1 gen 1998 anni
1.494
+0.125
9.11%
1 gen 1999 anni
1.184
-0.31
-20.72%
1 gen 2000 anni
2.145
+0.96
81.1%
1 gen 2001 anni
3.432
+1.288
60.04%
1 gen 2002 anni
3.006
-0.426
-12.42%
1 gen 2003 anni
3.222
+0.216
7.19%
1 gen 2004 anni
3.969
+0.747
23.2%
1 gen 2005 anni
4.862
+0.893
22.49%
1 gen 2006 anni
4.893
+0.031
0.64%
1 gen 2007 anni
4.695
-0.199
-4.06%
1 gen 2008 anni
4.81
+0.115
2.44%
1 gen 2009 anni
4.642
-0.167
-3.48%
1 gen 2010 anni
4.905
+0.262
5.65%
1 gen 2011 anni
6.441
+1.536
31.32%
1 gen 2012 anni
4.385
-2.057
-31.93%
1 gen 2013 anni
4.407
+0.022
0.51%
1 gen 2014 anni
4.026
-0.381
-8.65%
1 gen 2015 anni
5.398
+1.372
34.08%
1 gen 2016 anni
5.643
+0.245
4.55%
Classificazione dei paesi secondo i statistiche attuali per anni


Commenti: