29
/it/
it
AIzaSyAYiBZKx7MnpbEhh9jyipgxe19OcubqV5w
April 1, 2024
125548
Egypt, Arab Rep.
EGY
true
2
1
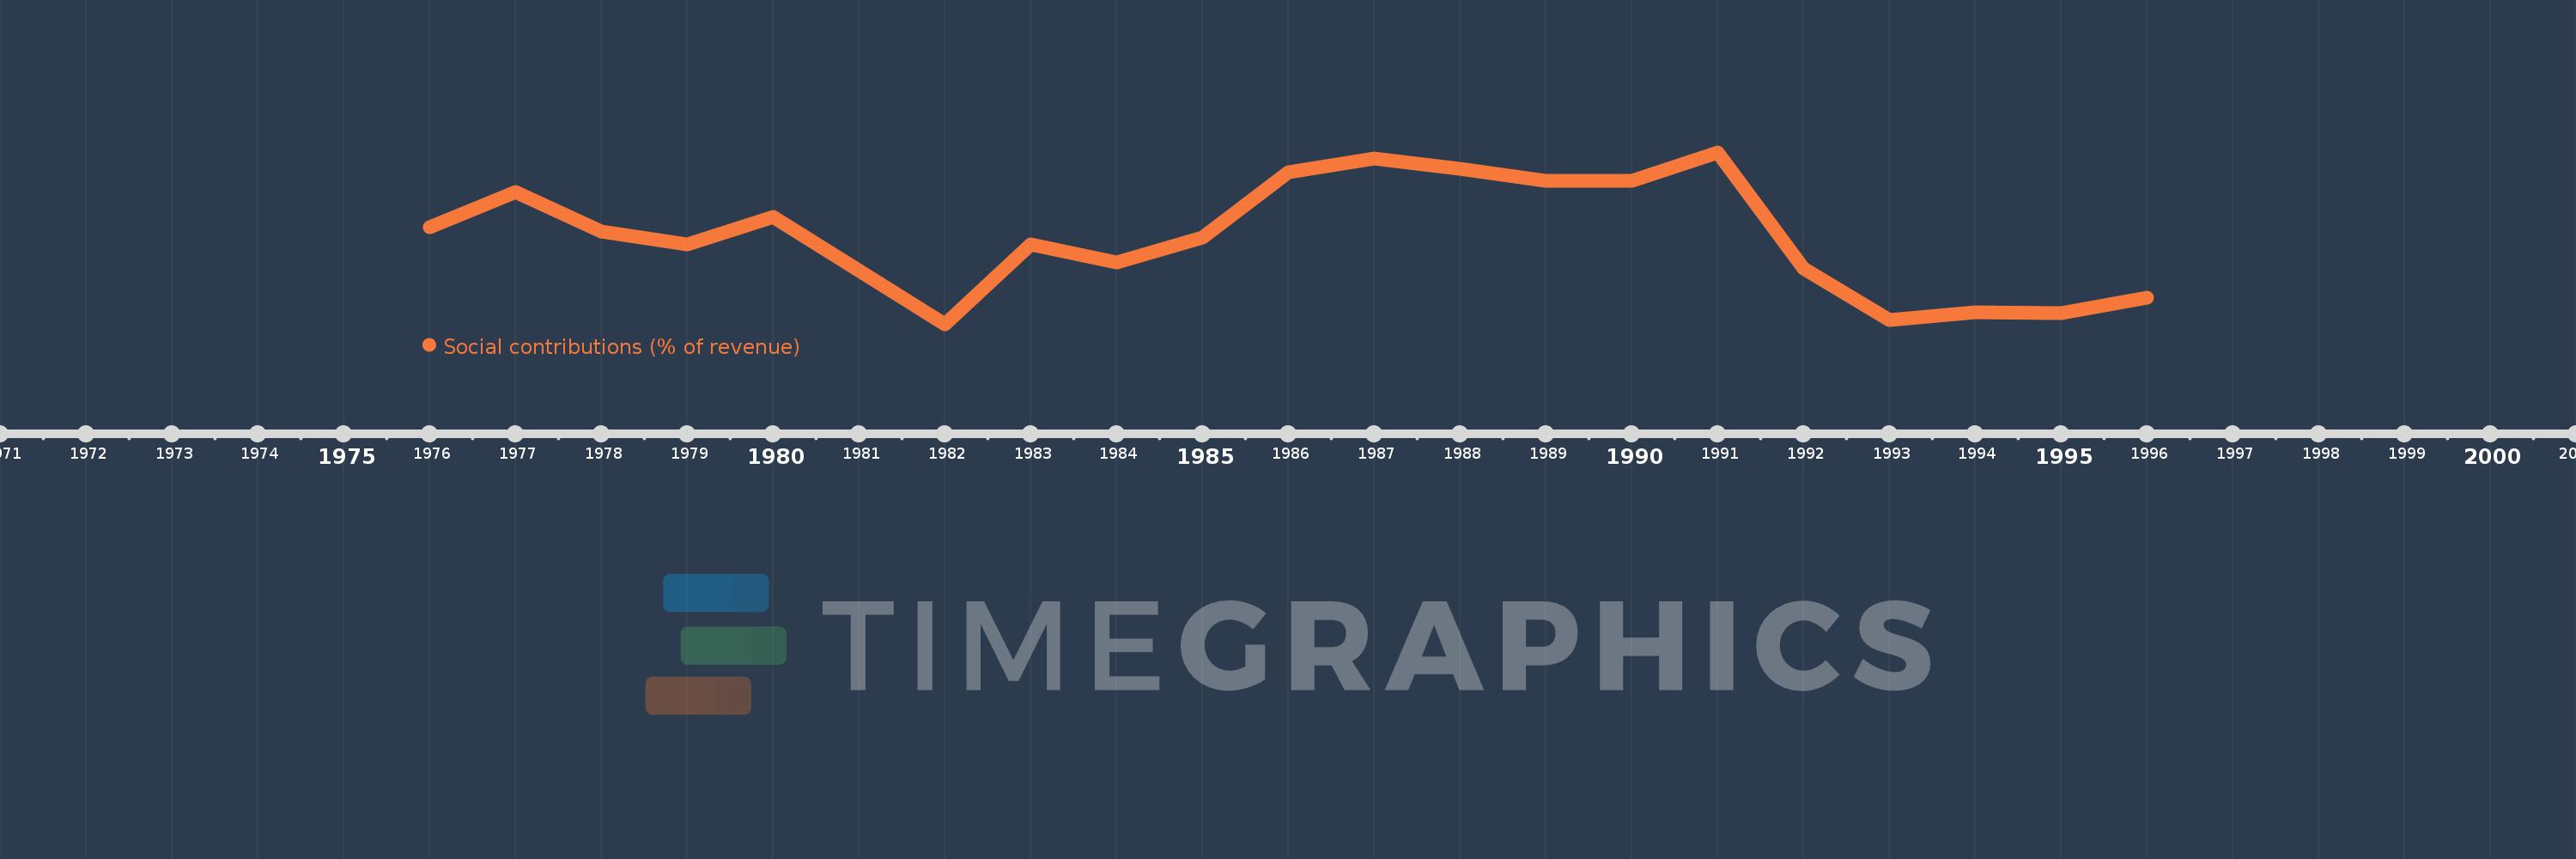
Social contributions (% of revenue)
1996,1995,1994,1993,1992,1991,1990,1989,1988,1987,1986,1985,1984,1983,1982,1980,1979,1978,1977,1976
Queste statistiche in altri paesi:
Linea del tempo:
Questa scala temporale mostra un grafico dal 1976 anno al 1996 anno. Egypt, Arab Rep.. I dati fino ad 1975 anno non disponibili. Il numero di osservazioni attuali secondo i date: 20.
La fonte (nome):
Indicatori dello sviluppo mondiale
La fonte (organizzazione):
International Monetary Fund, Government Finance Statistics Yearbook and data files.
Categorie:
Public Sector
sono stati aggiornati
23 apr 2017 anni
Indicatori delle variazioni dei valori per anni
Minima:
8.957
1 gen 1982 anni
Massimo:
14.515
1 gen 1991 anni
Alla data di osservazione
Valore
Variazione assoluta
La variazione rispetto al valore precedente
1 gen 1976 anni
12.081
+12.081
0.0%
1 gen 1977 anni
13.243
+1.162
9.62%
1 gen 1978 anni
11.966
-1.277
-9.64%
1 gen 1979 anni
11.54
-0.426
-3.56%
1 gen 1980 anni
12.423
+0.882
7.64%
1 gen 1982 anni
8.957
-3.465
-27.9%
1 gen 1983 anni
11.529
+2.572
28.71%
1 gen 1984 anni
10.967
-0.562
-4.88%
1 gen 1985 anni
11.748
+0.781
7.12%
1 gen 1986 anni
13.862
+2.114
17.99%
1 gen 1987 anni
14.309
+0.447
3.23%
1 gen 1988 anni
13.978
-0.331
-2.31%
1 gen 1989 anni
13.598
-0.38
-2.72%
1 gen 1990 anni
13.585
-0.013
-0.09%
1 gen 1991 anni
14.515
+0.93
6.84%
1 gen 1992 anni
10.773
-3.742
-25.78%
1 gen 1993 anni
9.084
-1.689
-15.67%
1 gen 1994 anni
9.345
+0.26
2.87%
1 gen 1995 anni
9.305
-0.039
-0.42%
1 gen 1996 anni
9.807
+0.501
5.38%
Classificazione dei paesi secondo i statistiche attuali per anni


Commenti: