30
/it/
AIzaSyAYiBZKx7MnpbEhh9jyipgxe19OcubqV5w
April 1, 2024
25331
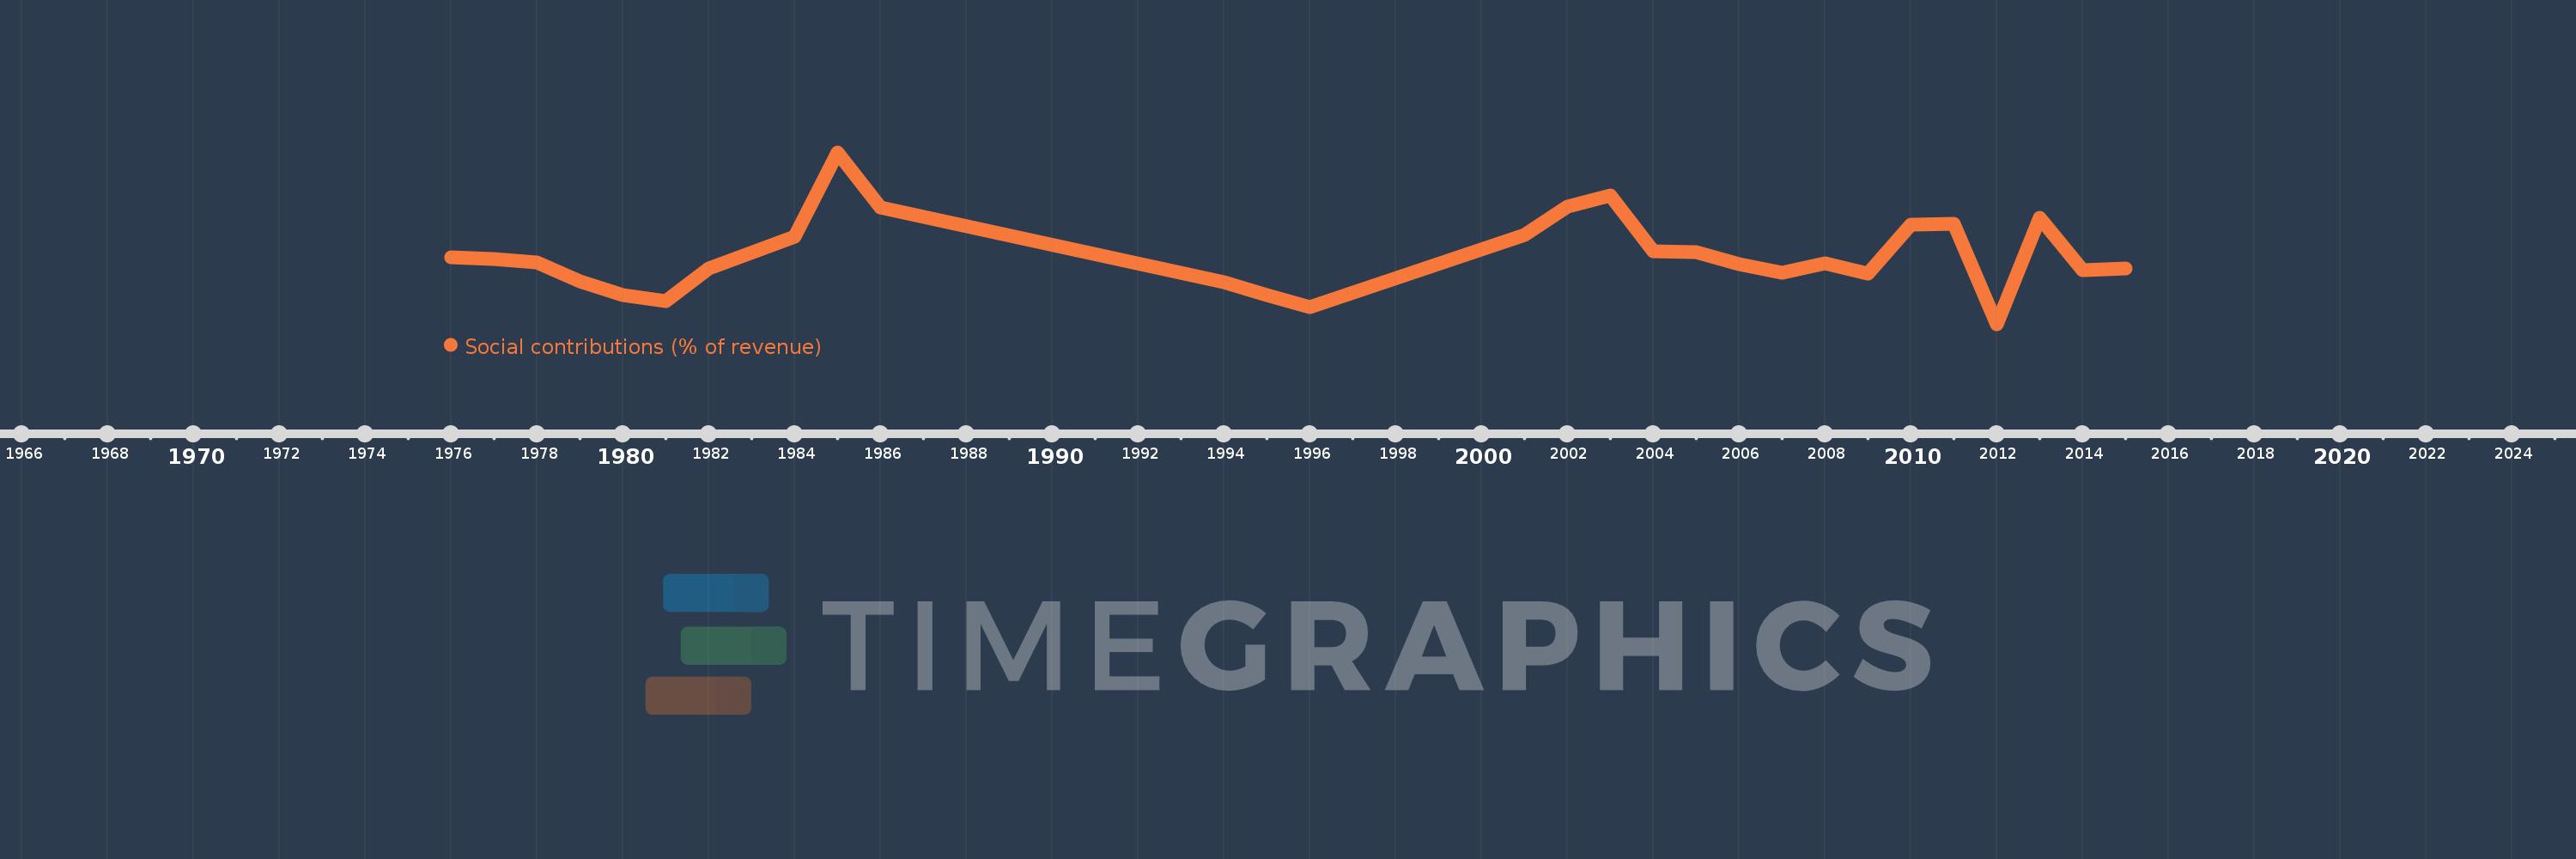
Caribbean small states
CSS
false
2
1
Social contributions (% of revenue)
2015,2014,2013,2012,2011,2010,2009,2008,2007,2006,2005,2004,2003,2002,2001,1996,1995,1994,1986,1985,1984,1982,1981,1980,1979,1978,1977,1976
