29
/pt/
pt
AIzaSyAYiBZKx7MnpbEhh9jyipgxe19OcubqV5w
April 1, 2024
153097
Hungary
HUN
true
2
1
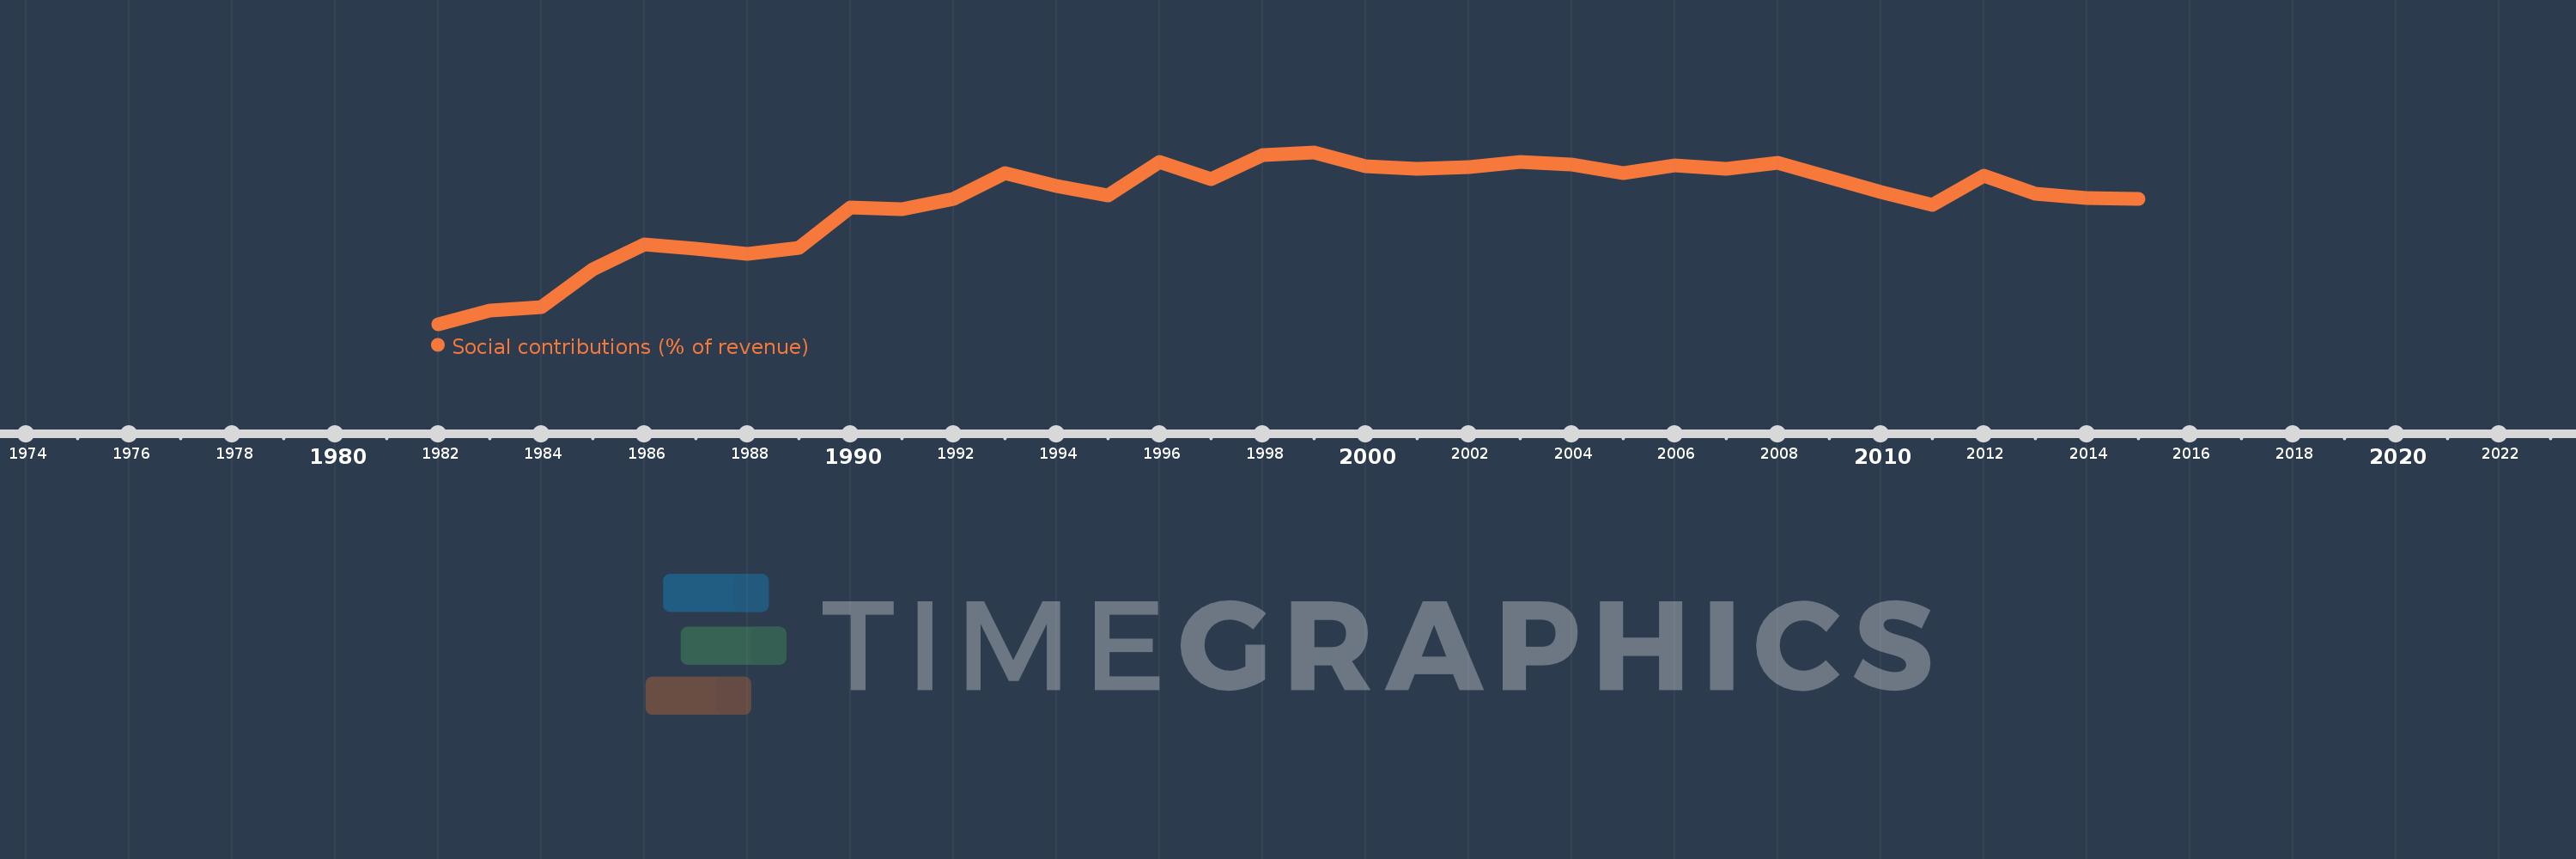
Social contributions (% of revenue)
2015,2014,2013,2012,2011,2010,2009,2008,2007,2006,2005,2004,2003,2002,2001,2000,1999,1998,1997,1996,1995,1994,1993,1992,1991,1990,1989,1988,1987,1986,1985,1984,1983,1982
Estas estatísticas em outros países:
Linha do tempo:
Nesta escala de tempo está apresentado um gráfico de 1982 ano até 2015 ano Hungary. Dados de 1981 ano ausente. O número de observações reais por data: 34.
Fonte (nome):
Indicadores de desenvolvimento mundial
Fonte (organização):
International Monetary Fund, Government Finance Statistics Yearbook and data files.
Categorias:
Public Sector
Foi atualizado:
23 abr 2017 ano
Indicadores de alterações dos valores ao longo dos anos
Mínimo:
15.307
1 jan 1982 ano
Máximo:
36.048
1 jan 1999 ano
Na data de observação
Valor
Mudança absoluta
A alteração em relação ao valor anterior
1 jan 1982 ano
15.307
+15.307
0.0%
1 jan 1983 ano
16.982
+1.675
10.94%
1 jan 1984 ano
17.379
+0.397
2.34%
1 jan 1985 ano
21.917
+4.538
26.11%
1 jan 1986 ano
24.93
+3.013
13.75%
1 jan 1987 ano
24.473
-0.458
-1.84%
1 jan 1988 ano
23.849
-0.623
-2.55%
1 jan 1989 ano
24.497
+0.648
2.72%
1 jan 1990 ano
29.381
+4.884
19.94%
1 jan 1991 ano
29.225
-0.155
-0.53%
1 jan 1992 ano
30.408
+1.183
4.05%
1 jan 1993 ano
33.542
+3.134
10.31%
1 jan 1994 ano
32.001
-1.541
-4.59%
1 jan 1995 ano
30.874
-1.127
-3.52%
1 jan 1996 ano
34.861
+3.987
12.91%
1 jan 1997 ano
32.834
-2.027
-5.81%
1 jan 1998 ano
35.732
+2.899
8.83%
1 jan 1999 ano
36.048
+0.316
0.88%
1 jan 2000 ano
34.381
-1.667
-4.62%
1 jan 2001 ano
34.03
-0.351
-1.02%
1 jan 2002 ano
34.261
+0.231
0.68%
1 jan 2003 ano
34.88
+0.62
1.81%
1 jan 2004 ano
34.562
-0.318
-0.91%
1 jan 2005 ano
33.598
-0.964
-2.79%
1 jan 2006 ano
34.494
+0.895
2.66%
1 jan 2007 ano
34.106
-0.388
-1.12%
1 jan 2008 ano
34.779
+0.674
1.98%
1 jan 2009 ano
33.049
-1.73
-4.98%
1 jan 2010 ano
31.302
-1.747
-5.29%
1 jan 2011 ano
29.74
-1.562
-4.99%
1 jan 2012 ano
33.231
+3.491
11.74%
1 jan 2013 ano
31.032
-2.199
-6.62%
1 jan 2014 ano
30.567
-0.465
-1.5%
1 jan 2015 ano
30.417
-0.15
-0.49%
Classificação de países por estatísticas atuais por anos


Comentários: