29
/fr/
fr
AIzaSyAYiBZKx7MnpbEhh9jyipgxe19OcubqV5w
April 1, 2024
97320
Cabo Verde
CPV
true
2
1
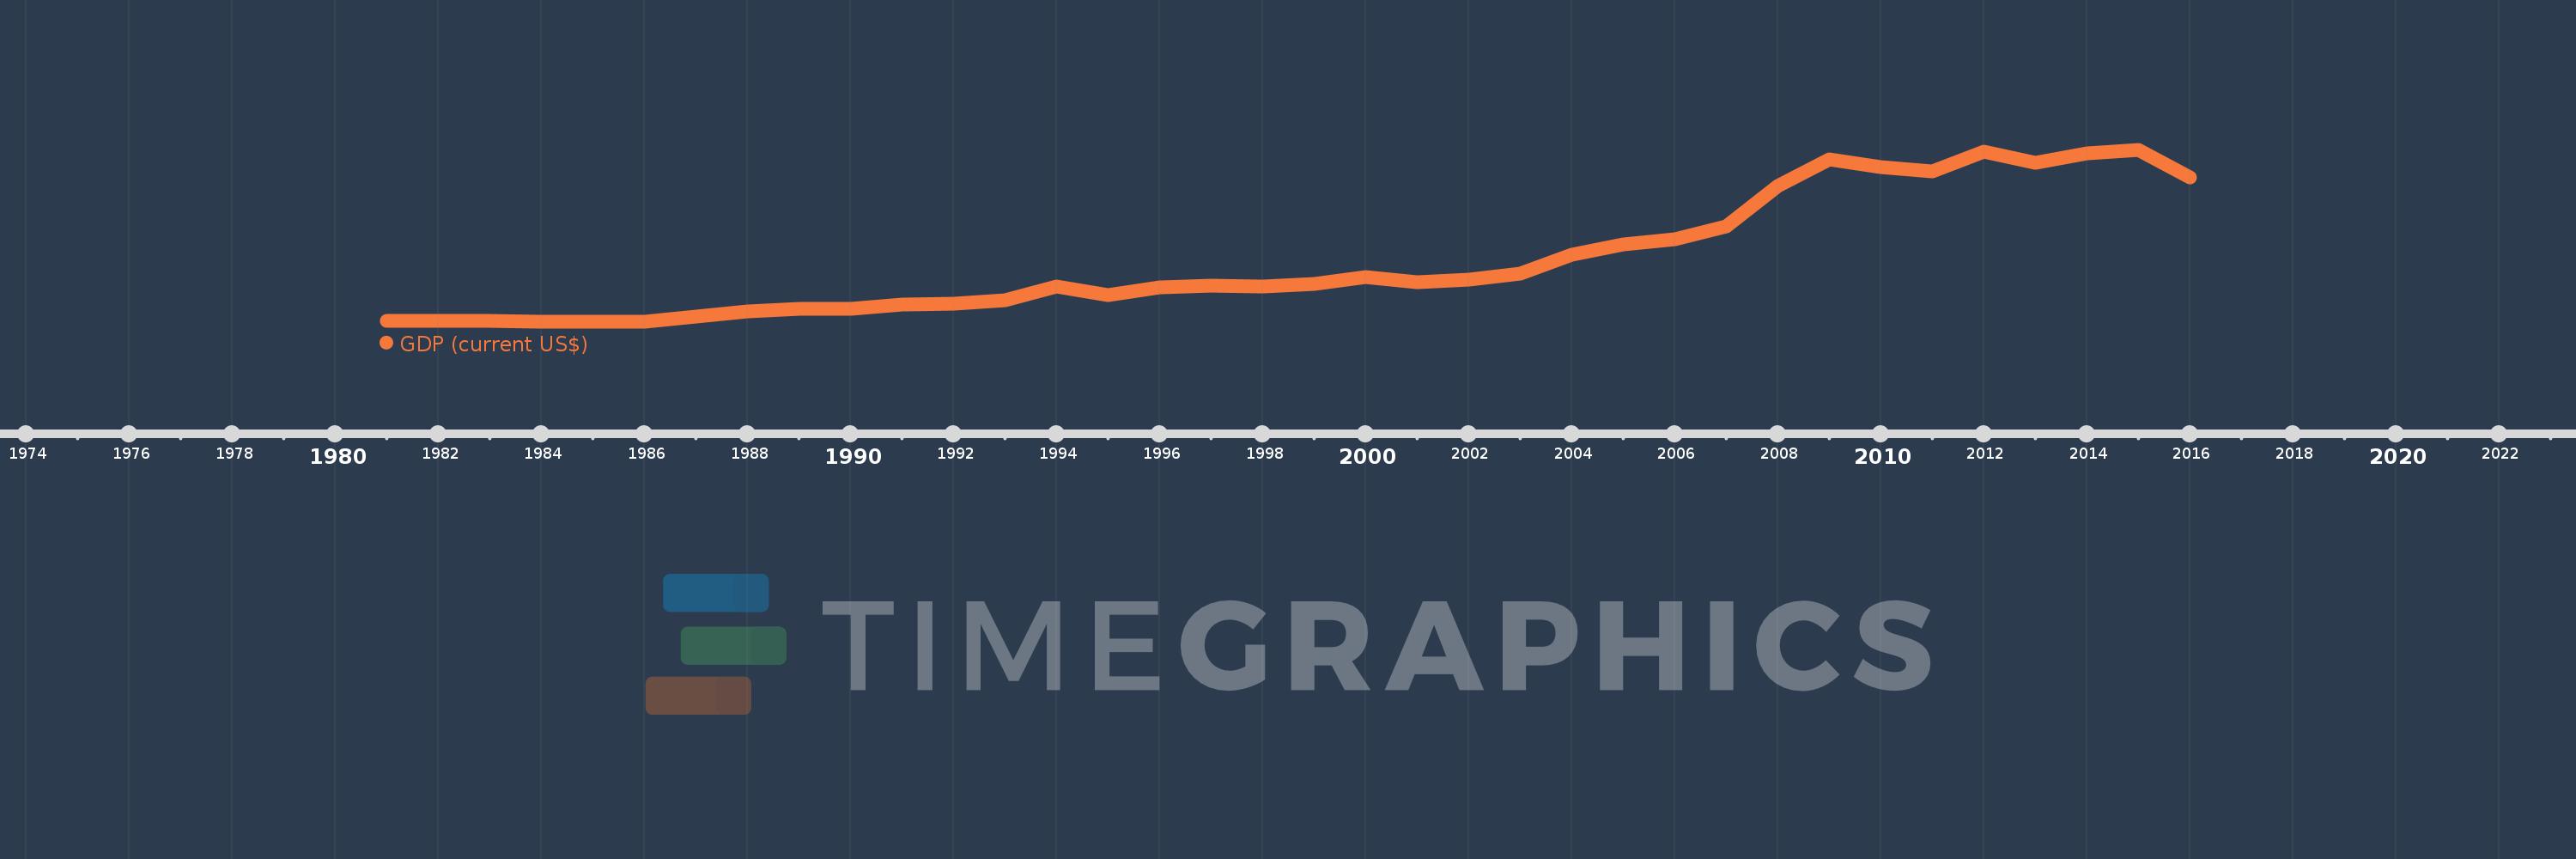
GDP (current US$)
2016,2015,2014,2013,2012,2011,2010,2009,2008,2007,2006,2005,2004,2003,2002,2001,2000,1999,1998,1997,1996,1995,1994,1993,1992,1991,1990,1989,1988,1987,1986,1985,1984,1983,1982,1981
Cette statistique dans les autres pays:
AfghanistanAlbaniaAlgeriaAndorraAngolaAntigua and BarbudaArab WorldArgentinaArmeniaArubaAustraliaAustriaAzerbaijanBahamas, TheBahrainBangladeshBarbadosBelarusBelgiumBelizeBeninBermudaBhutanBoliviaBosnia and HerzegovinaBotswanaBrazilBrunei DarussalamBulgariaBurkina FasoBurundiCabo VerdeCambodiaCameroonCanadaCaribbean small statesCayman IslandsCentral African RepublicCentral Europe and the BalticsChadChannel IslandsChileChinaColombiaComorosCongo, Dem. Rep.Congo, Rep.Costa RicaCote d'IvoireCroatiaCubaCyprusCzech RepublicDenmarkDjiboutiDominicaDominican RepublicEarly-demographic dividendEast Asia & PacificEast Asia & Pacific (excluding high income)East Asia & Pacific (IDA & IBRD countries)EcuadorEgypt, Arab Rep.El SalvadorEquatorial GuineaEritreaEstoniaEthiopiaEuro areaEurope & Central AsiaEurope & Central Asia (excluding high income)Europe & Central Asia (IDA & IBRD countries)European UnionFaroe IslandsFijiFinlandFragile and conflict affected situationsFranceFrench PolynesiaGabonGambia, TheGeorgiaGermanyGhanaGreeceGreenlandGrenadaGuatemalaGuineaGuinea-BissauGuyanaHaitiHeavily indebted poor countries (HIPC)High incomeHondurasHong Kong SAR, ChinaHungaryIBRD onlyIcelandIDA & IBRD totalIDA blendIDA onlyIDA totalIndiaIndonesiaIran, Islamic Rep.IraqIrelandIsle of ManIsraelItalyJamaicaJapanJordanKazakhstanKenyaKiribatiKorea, Rep.KosovoKuwaitKyrgyz RepublicLao PDRLate-demographic dividendLatin America & Caribbean Latin America & Caribbean (excluding high income)Latin America & the Caribbean (IDA & IBRD countries)LatviaLeast developed countries: UN classificationLebanonLesothoLiberiaLibyaLiechtensteinLithuaniaLow & middle incomeLow incomeLower middle incomeLuxembourgMacao SAR, ChinaMacedonia, FYRMadagascarMalawiMalaysiaMaldivesMaliMaltaMarshall IslandsMauritaniaMauritiusMexicoMicronesia, Fed. Sts.Middle East & North AfricaMiddle East & North Africa (excluding high income)Middle East & North Africa (IDA & IBRD countries)Middle incomeMoldovaMonacoMongoliaMontenegroMoroccoMozambiqueMyanmarNamibiaNauruNepalNetherlandsNew CaledoniaNew ZealandNicaraguaNigerNigeriaNorth AmericaNorwayOECD membersOmanOther small statesPacific island small statesPakistanPalauPanamaPapua New GuineaParaguayPeruPhilippinesPolandPortugalPost-demographic dividendPre-demographic dividendPuerto RicoQatarRomaniaRussian FederationRwandaSamoaSan MarinoSao Tome and PrincipeSaudi ArabiaSenegalSerbiaSeychellesSierra LeoneSingaporeSlovak RepublicSloveniaSmall statesSolomon IslandsSomaliaSouth AfricaSouth AsiaSouth Asia (IDA & IBRD)South SudanSpainSri LankaSt. Kitts and NevisSt. LuciaSt. Vincent and the GrenadinesSub-Saharan Africa Sub-Saharan Africa (excluding high income)Sub-Saharan Africa (IDA & IBRD countries)SudanSurinameSwazilandSwedenSwitzerlandSyrian Arab RepublicTajikistanTanzaniaThailandTimor-LesteTogoTongaTrinidad and TobagoTunisiaTurkeyTurkmenistanTuvaluUgandaUkraineUnited Arab EmiratesUnited KingdomUnited StatesUpper middle incomeUruguayUzbekistanVanuatuVenezuela, RBVietnamVirgin Islands (U.S.)West Bank and GazaWorldYemen, Rep.ZambiaZimbabwe La ligne de temps
Cette échelle de temps montre un graphique de 1981 année à 2016 année Cabo Verde. Les données jusqu'à 1980 année ne sont pas présentés. Quantité d'observations actuelles selon dates: 36.
Source (désignation):
Les indicateurs du développement mondiale
Source (organisation):
World Bank national accounts data, and OECD National Accounts data files.
Catégories:
Economy & Growth
Dernière mise à jour
23 avr. 2017
Les indicateurs de changement de valeurs selon les années
Minimum:
132.019 mln.
1 janv. 1985
Maximum:
1.881 mds
1 janv. 2015
Pour la date d''observation
Valeur
Changement absolu
Le changement par rapport à la valeur précédente
1 janv. 1981
142.247 mln.
+142.247 mln.
0.0%
1 janv. 1982
139.468 mln.
-2.779 mln.
-1.95%
1 janv. 1983
140.631 mln.
+1.163 mln.
0.83%
1 janv. 1984
138.476 mln.
-2.155 mln.
-1.53%
1 janv. 1985
132.019 mln.
-6.457 mln.
-4.66%
1 janv. 1986
137.728 mln.
+5.709 mln.
4.32%
1 janv. 1987
190.651 mln.
+52.923 mln.
38.43%
1 janv. 1988
235.253 mln.
+44.602 mln.
23.39%
1 janv. 1989
264.308 mln.
+29.055 mln.
12.35%
1 janv. 1990
267.449 mln.
+3.14 mln.
1.19%
1 janv. 1991
306.891 mln.
+39.443 mln.
14.75%
1 janv. 1992
319.827 mln.
+12.936 mln.
4.22%
1 janv. 1993
357.161 mln.
+37.334 mln.
11.67%
1 janv. 1994
490.417 mln.
+133.256 mln.
37.31%
1 janv. 1995
406.581 mln.
-83.837 mln.
-17.09%
1 janv. 1996
487.149 mln.
+80.568 mln.
19.82%
1 janv. 1997
501.979 mln.
+14.83 mln.
3.04%
1 janv. 1998
490.609 mln.
-11.37 mln.
-2.27%
1 janv. 1999
521.911 mln.
+31.302 mln.
6.38%
1 janv. 2000
592.417 mln.
+70.506 mln.
13.51%
1 janv. 2001
539.227 mln.
-53.189 mln.
-8.98%
1 janv. 2002
563.024 mln.
+23.797 mln.
4.41%
1 janv. 2003
620.975 mln.
+57.95 mln.
10.29%
1 janv. 2004
813.964 mln.
+192.989 mln.
31.08%
1 janv. 2005
924.318 mln.
+110.355 mln.
13.56%
1 janv. 2006
971.977 mln.
+47.659 mln.
5.16%
1 janv. 2007
1.108 mds
+135.914 mln.
13.98%
1 janv. 2008
1.514 mds
+406.043 mln.
36.65%
1 janv. 2009
1.789 mds
+275.399 mln.
18.19%
1 janv. 2010
1.712 mds
-77.516 mln.
-4.33%
1 janv. 2011
1.664 mds
-47.506 mln.
-2.78%
1 janv. 2012
1.865 mds
+200.513 mln.
12.05%
1 janv. 2013
1.752 mds
-112.936 mln.
-6.06%
1 janv. 2014
1.851 mds
+99.064 mln.
5.65%
1 janv. 2015
1.881 mds
+30.544 mln.
1.65%
1 janv. 2016
1.603 mds
-278.257 mln.
-14.79%
Classement des pays selon les statistiques actuelles par années


Commentaires: