29
/fr/
fr
AIzaSyAYiBZKx7MnpbEhh9jyipgxe19OcubqV5w
April 1, 2024
251887
St. Vincent and the Grenadines
VCT
true
2
1
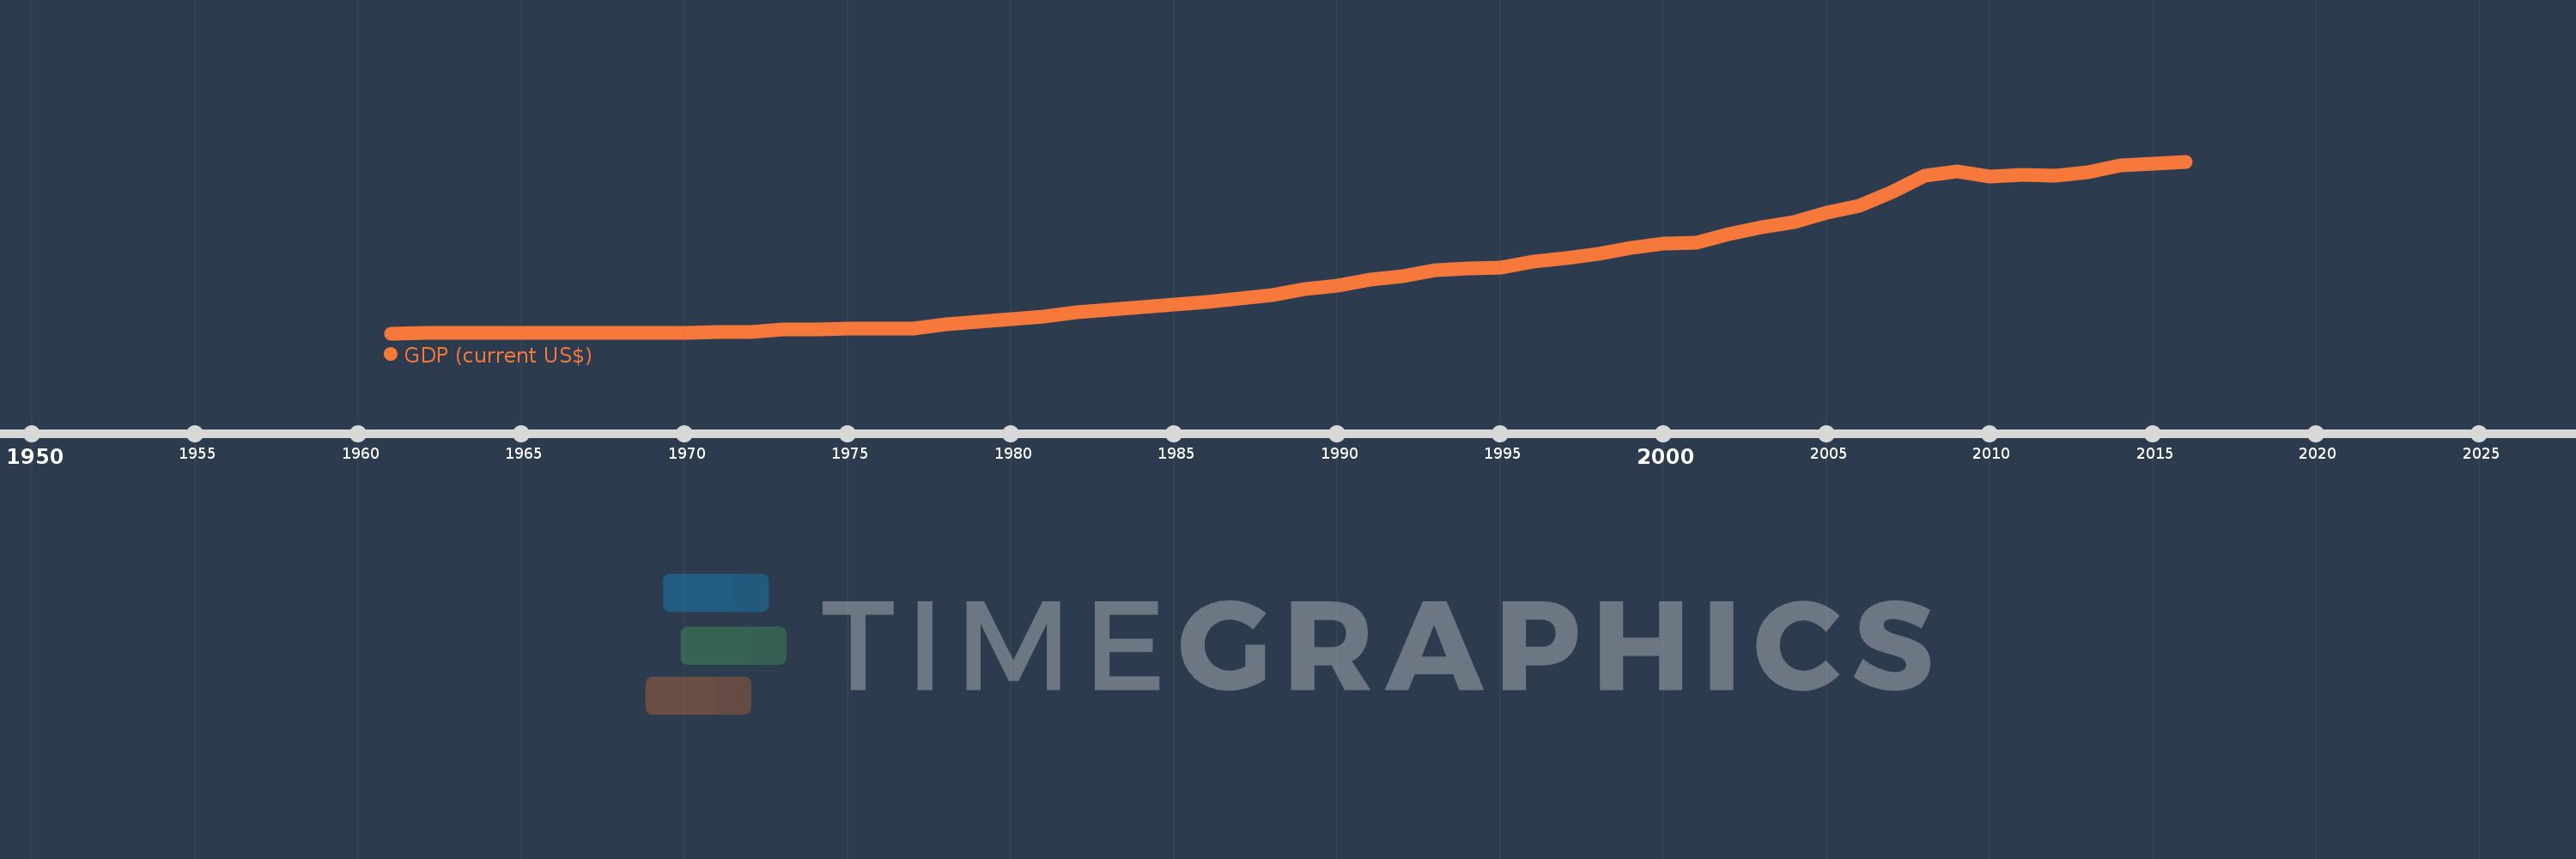
GDP (current US$)
2016,2015,2014,2013,2012,2011,2010,2009,2008,2007,2006,2005,2004,2003,2002,2001,2000,1999,1998,1997,1996,1995,1994,1993,1992,1991,1990,1989,1988,1987,1986,1985,1984,1983,1982,1981,1980,1979,1978,1977,1976,1975,1974,1973,1972,1971,1970,1969,1968,1967,1966,1965,1964,1963,1962,1961
Cette statistique dans les autres pays:
AfghanistanAlbaniaAlgeriaAndorraAngolaAntigua and BarbudaArab WorldArgentinaArmeniaArubaAustraliaAustriaAzerbaijanBahamas, TheBahrainBangladeshBarbadosBelarusBelgiumBelizeBeninBermudaBhutanBoliviaBosnia and HerzegovinaBotswanaBrazilBrunei DarussalamBulgariaBurkina FasoBurundiCabo VerdeCambodiaCameroonCanadaCaribbean small statesCayman IslandsCentral African RepublicCentral Europe and the BalticsChadChannel IslandsChileChinaColombiaComorosCongo, Dem. Rep.Congo, Rep.Costa RicaCote d'IvoireCroatiaCubaCyprusCzech RepublicDenmarkDjiboutiDominicaDominican RepublicEarly-demographic dividendEast Asia & PacificEast Asia & Pacific (excluding high income)East Asia & Pacific (IDA & IBRD countries)EcuadorEgypt, Arab Rep.El SalvadorEquatorial GuineaEritreaEstoniaEthiopiaEuro areaEurope & Central AsiaEurope & Central Asia (excluding high income)Europe & Central Asia (IDA & IBRD countries)European UnionFaroe IslandsFijiFinlandFragile and conflict affected situationsFranceFrench PolynesiaGabonGambia, TheGeorgiaGermanyGhanaGreeceGreenlandGrenadaGuatemalaGuineaGuinea-BissauGuyanaHaitiHeavily indebted poor countries (HIPC)High incomeHondurasHong Kong SAR, ChinaHungaryIBRD onlyIcelandIDA & IBRD totalIDA blendIDA onlyIDA totalIndiaIndonesiaIran, Islamic Rep.IraqIrelandIsle of ManIsraelItalyJamaicaJapanJordanKazakhstanKenyaKiribatiKorea, Rep.KosovoKuwaitKyrgyz RepublicLao PDRLate-demographic dividendLatin America & Caribbean Latin America & Caribbean (excluding high income)Latin America & the Caribbean (IDA & IBRD countries)LatviaLeast developed countries: UN classificationLebanonLesothoLiberiaLibyaLiechtensteinLithuaniaLow & middle incomeLow incomeLower middle incomeLuxembourgMacao SAR, ChinaMacedonia, FYRMadagascarMalawiMalaysiaMaldivesMaliMaltaMarshall IslandsMauritaniaMauritiusMexicoMicronesia, Fed. Sts.Middle East & North AfricaMiddle East & North Africa (excluding high income)Middle East & North Africa (IDA & IBRD countries)Middle incomeMoldovaMonacoMongoliaMontenegroMoroccoMozambiqueMyanmarNamibiaNauruNepalNetherlandsNew CaledoniaNew ZealandNicaraguaNigerNigeriaNorth AmericaNorwayOECD membersOmanOther small statesPacific island small statesPakistanPalauPanamaPapua New GuineaParaguayPeruPhilippinesPolandPortugalPost-demographic dividendPre-demographic dividendPuerto RicoQatarRomaniaRussian FederationRwandaSamoaSan MarinoSao Tome and PrincipeSaudi ArabiaSenegalSerbiaSeychellesSierra LeoneSingaporeSlovak RepublicSloveniaSmall statesSolomon IslandsSomaliaSouth AfricaSouth AsiaSouth Asia (IDA & IBRD)South SudanSpainSri LankaSt. Kitts and NevisSt. LuciaSt. Vincent and the GrenadinesSub-Saharan Africa Sub-Saharan Africa (excluding high income)Sub-Saharan Africa (IDA & IBRD countries)SudanSurinameSwazilandSwedenSwitzerlandSyrian Arab RepublicTajikistanTanzaniaThailandTimor-LesteTogoTongaTrinidad and TobagoTunisiaTurkeyTurkmenistanTuvaluUgandaUkraineUnited Arab EmiratesUnited KingdomUnited StatesUpper middle incomeUruguayUzbekistanVanuatuVenezuela, RBVietnamVirgin Islands (U.S.)West Bank and GazaWorldYemen, Rep.ZambiaZimbabwe La ligne de temps
Cette échelle de temps montre un graphique de 1961 année à 2016 année St. Vincent and the Grenadines. Les données jusqu'à 1960 année ne sont pas présentés. Quantité d'observations actuelles selon dates: 56.
Source (désignation):
Les indicateurs du développement mondiale
Source (organisation):
World Bank national accounts data, and OECD National Accounts data files.
Catégories:
Economy & Growth
Dernière mise à jour
23 avr. 2017
Les indicateurs de changement de valeurs selon les années
Minimum:
13.067 mln.
1 janv. 1961
Maximum:
737.684 mln.
1 janv. 2016
Pour la date d''observation
Valeur
Changement absolu
Le changement par rapport à la valeur précédente
1 janv. 1961
13.067 mln.
+13.067 mln.
0.0%
1 janv. 1962
14.0 mln.
+933.326 milles
7.14%
1 janv. 1963
14.525 mln.
+524.996 milles
3.75%
1 janv. 1964
13.708 mln.
-816.66 milles
-5.62%
1 janv. 1965
14.758 mln.
+1.05 mln.
7.66%
1 janv. 1966
15.108 mln.
+349.997 milles
2.37%
1 janv. 1967
16.1 mln.
+991.658 milles
6.56%
1 janv. 1968
15.835 mln.
-264.688 milles
-1.64%
1 janv. 1969
15.35 mln.
-485.178 milles
-3.06%
1 janv. 1970
16.65 mln.
+1.3 mln.
8.47%
1 janv. 1971
18.45 mln.
+1.8 mln.
10.81%
1 janv. 1972
20.052 mln.
+1.602 mln.
8.68%
1 janv. 1973
27.585 mln.
+7.534 mln.
37.57%
1 janv. 1974
30.165 mln.
+2.58 mln.
9.35%
1 janv. 1975
32.924 mln.
+2.759 mln.
9.15%
1 janv. 1976
33.237 mln.
+312.949 milles
0.95%
1 janv. 1977
32.792 mln.
-444.684 milles
-1.34%
1 janv. 1978
49.353 mln.
+16.561 mln.
50.5%
1 janv. 1979
60.845 mln.
+11.492 mln.
23.28%
1 janv. 1980
71.096 mln.
+10.252 mln.
16.85%
1 janv. 1981
82.34 mln.
+11.244 mln.
15.82%
1 janv. 1982
102.087 mln.
+19.746 mln.
23.98%
1 janv. 1983
113.759 mln.
+11.673 mln.
11.43%
1 janv. 1984
122.255 mln.
+8.496 mln.
7.47%
1 janv. 1985
135.025 mln.
+12.77 mln.
10.45%
1 janv. 1986
145.642 mln.
+10.617 mln.
7.86%
1 janv. 1987
160.847 mln.
+15.205 mln.
10.44%
1 janv. 1988
175.581 mln.
+14.734 mln.
9.16%
1 janv. 1989
200.727 mln.
+25.146 mln.
14.32%
1 janv. 1990
214.745 mln.
+14.018 mln.
6.98%
1 janv. 1991
240.365 mln.
+25.62 mln.
11.93%
1 janv. 1992
254.83 mln.
+14.464 mln.
6.02%
1 janv. 1993
277.954 mln.
+23.124 mln.
9.07%
1 janv. 1994
286.308 mln.
+8.354 mln.
3.01%
1 janv. 1995
289.438 mln.
+3.131 mln.
1.09%
1 janv. 1996
316.008 mln.
+26.57 mln.
9.18%
1 janv. 1997
331.49 mln.
+15.481 mln.
4.9%
1 janv. 1998
347.77 mln.
+16.28 mln.
4.91%
1 janv. 1999
373.62 mln.
+25.85 mln.
7.43%
1 janv. 2000
390.719 mln.
+17.099 mln.
4.58%
1 janv. 2001
396.27 mln.
+5.551 mln.
1.42%
1 janv. 2002
430.04 mln.
+33.77 mln.
8.52%
1 janv. 2003
461.883 mln.
+31.843 mln.
7.4%
1 janv. 2004
481.806 mln.
+19.923 mln.
4.31%
1 janv. 2005
521.975 mln.
+40.169 mln.
8.34%
1 janv. 2006
550.729 mln.
+28.754 mln.
5.51%
1 janv. 2007
610.778 mln.
+60.05 mln.
10.9%
1 janv. 2008
678.323 mln.
+67.544 mln.
11.06%
1 janv. 2009
695.429 mln.
+17.106 mln.
2.52%
1 janv. 2010
674.922 mln.
-20.506 mln.
-2.95%
1 janv. 2011
681.226 mln.
+6.303 mln.
0.93%
1 janv. 2012
676.129 mln.
-5.097 mln.
-0.75%
1 janv. 2013
692.934 mln.
+16.804 mln.
2.49%
1 janv. 2014
721.207 mln.
+28.273 mln.
4.08%
1 janv. 2015
727.913 mln.
+6.706 mln.
0.93%
1 janv. 2016
737.684 mln.
+9.771 mln.
1.34%
Classement des pays selon les statistiques actuelles par années


Commentaires: