29
/fr/
fr
AIzaSyAYiBZKx7MnpbEhh9jyipgxe19OcubqV5w
April 1, 2024
264594
Togo
TGO
true
2
1
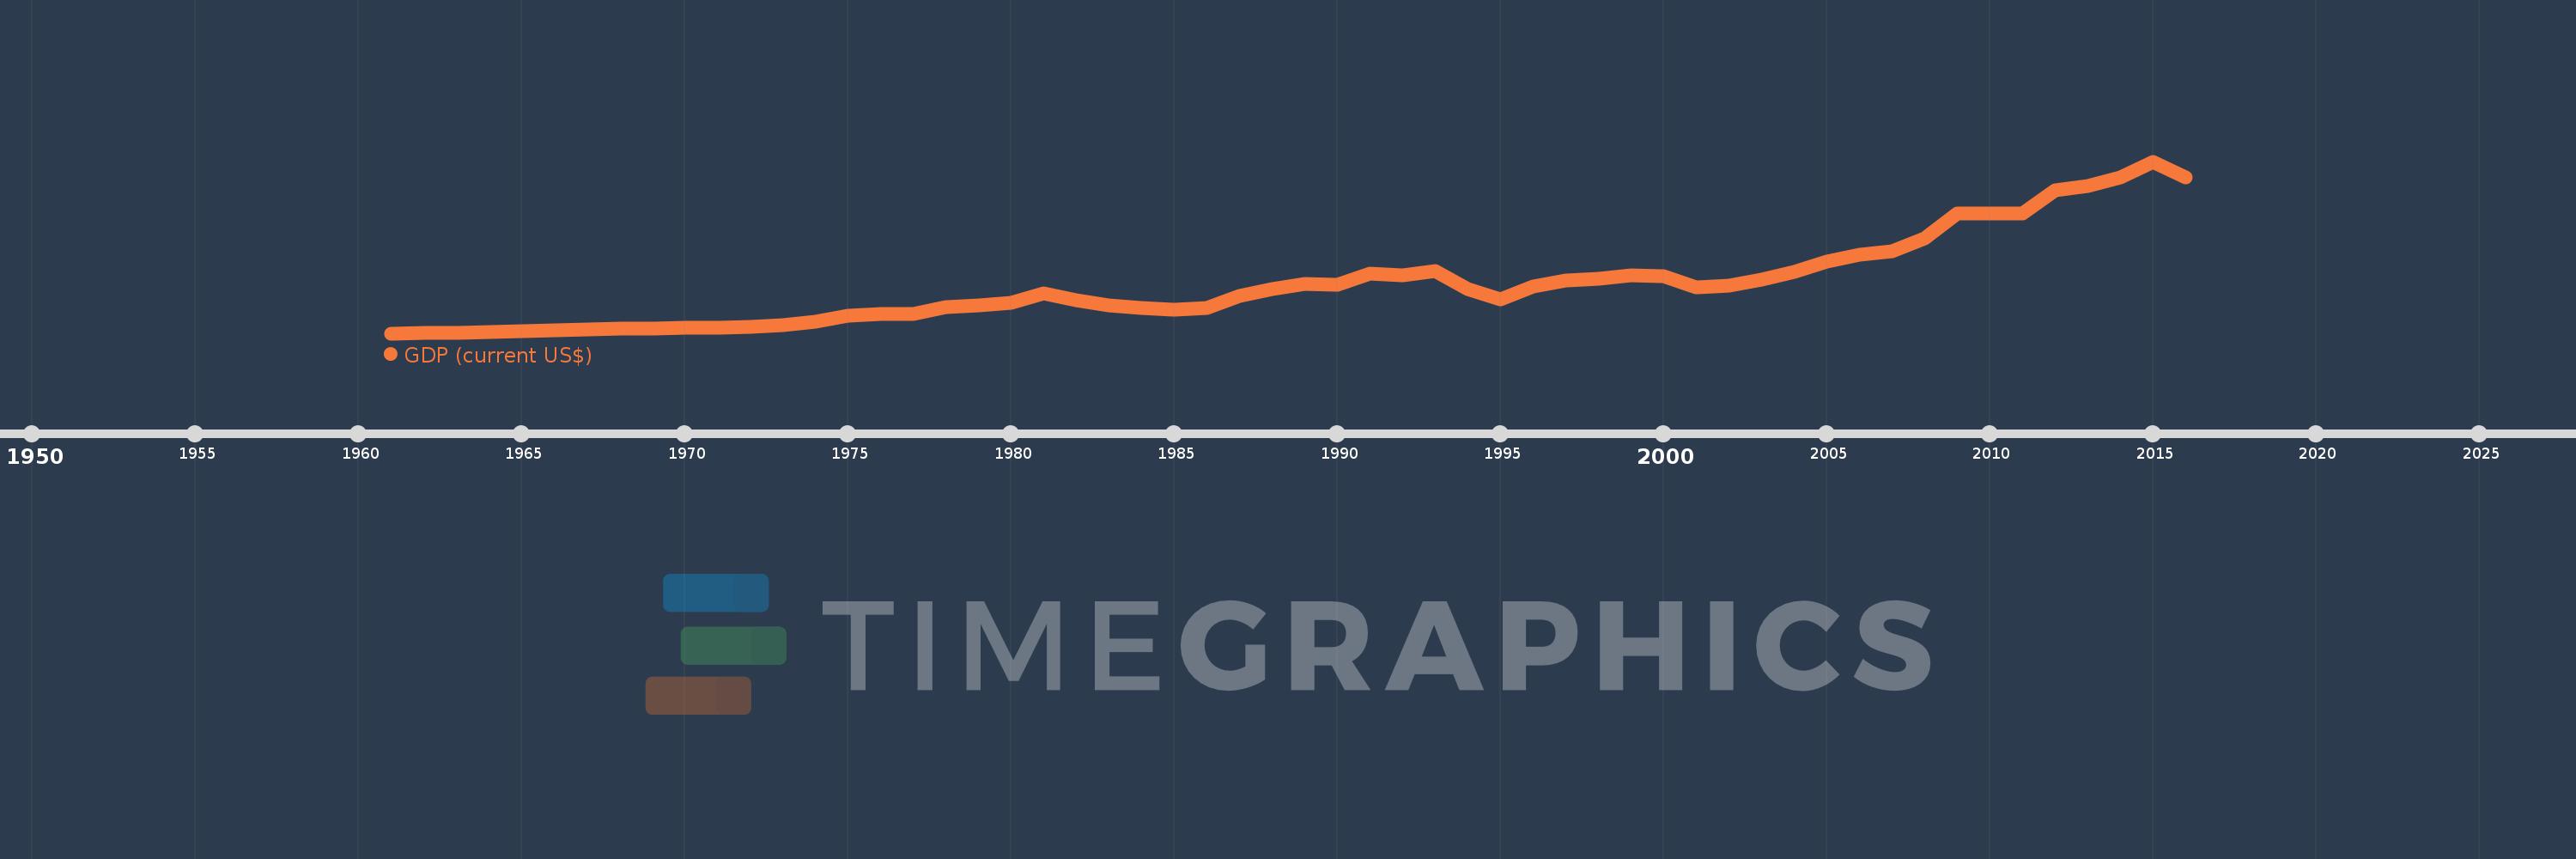
GDP (current US$)
2016,2015,2014,2013,2012,2011,2010,2009,2008,2007,2006,2005,2004,2003,2002,2001,2000,1999,1998,1997,1996,1995,1994,1993,1992,1991,1990,1989,1988,1987,1986,1985,1984,1983,1982,1981,1980,1979,1978,1977,1976,1975,1974,1973,1972,1971,1970,1969,1968,1967,1966,1965,1964,1963,1962,1961
Cette statistique dans les autres pays:
AfghanistanAlbaniaAlgeriaAndorraAngolaAntigua and BarbudaArab WorldArgentinaArmeniaArubaAustraliaAustriaAzerbaijanBahamas, TheBahrainBangladeshBarbadosBelarusBelgiumBelizeBeninBermudaBhutanBoliviaBosnia and HerzegovinaBotswanaBrazilBrunei DarussalamBulgariaBurkina FasoBurundiCabo VerdeCambodiaCameroonCanadaCaribbean small statesCayman IslandsCentral African RepublicCentral Europe and the BalticsChadChannel IslandsChileChinaColombiaComorosCongo, Dem. Rep.Congo, Rep.Costa RicaCote d'IvoireCroatiaCubaCyprusCzech RepublicDenmarkDjiboutiDominicaDominican RepublicEarly-demographic dividendEast Asia & PacificEast Asia & Pacific (excluding high income)East Asia & Pacific (IDA & IBRD countries)EcuadorEgypt, Arab Rep.El SalvadorEquatorial GuineaEritreaEstoniaEthiopiaEuro areaEurope & Central AsiaEurope & Central Asia (excluding high income)Europe & Central Asia (IDA & IBRD countries)European UnionFaroe IslandsFijiFinlandFragile and conflict affected situationsFranceFrench PolynesiaGabonGambia, TheGeorgiaGermanyGhanaGreeceGreenlandGrenadaGuatemalaGuineaGuinea-BissauGuyanaHaitiHeavily indebted poor countries (HIPC)High incomeHondurasHong Kong SAR, ChinaHungaryIBRD onlyIcelandIDA & IBRD totalIDA blendIDA onlyIDA totalIndiaIndonesiaIran, Islamic Rep.IraqIrelandIsle of ManIsraelItalyJamaicaJapanJordanKazakhstanKenyaKiribatiKorea, Rep.KosovoKuwaitKyrgyz RepublicLao PDRLate-demographic dividendLatin America & Caribbean Latin America & Caribbean (excluding high income)Latin America & the Caribbean (IDA & IBRD countries)LatviaLeast developed countries: UN classificationLebanonLesothoLiberiaLibyaLiechtensteinLithuaniaLow & middle incomeLow incomeLower middle incomeLuxembourgMacao SAR, ChinaMacedonia, FYRMadagascarMalawiMalaysiaMaldivesMaliMaltaMarshall IslandsMauritaniaMauritiusMexicoMicronesia, Fed. Sts.Middle East & North AfricaMiddle East & North Africa (excluding high income)Middle East & North Africa (IDA & IBRD countries)Middle incomeMoldovaMonacoMongoliaMontenegroMoroccoMozambiqueMyanmarNamibiaNauruNepalNetherlandsNew CaledoniaNew ZealandNicaraguaNigerNigeriaNorth AmericaNorwayOECD membersOmanOther small statesPacific island small statesPakistanPalauPanamaPapua New GuineaParaguayPeruPhilippinesPolandPortugalPost-demographic dividendPre-demographic dividendPuerto RicoQatarRomaniaRussian FederationRwandaSamoaSan MarinoSao Tome and PrincipeSaudi ArabiaSenegalSerbiaSeychellesSierra LeoneSingaporeSlovak RepublicSloveniaSmall statesSolomon IslandsSomaliaSouth AfricaSouth AsiaSouth Asia (IDA & IBRD)South SudanSpainSri LankaSt. Kitts and NevisSt. LuciaSt. Vincent and the GrenadinesSub-Saharan Africa Sub-Saharan Africa (excluding high income)Sub-Saharan Africa (IDA & IBRD countries)SudanSurinameSwazilandSwedenSwitzerlandSyrian Arab RepublicTajikistanTanzaniaThailandTimor-LesteTogoTongaTrinidad and TobagoTunisiaTurkeyTurkmenistanTuvaluUgandaUkraineUnited Arab EmiratesUnited KingdomUnited StatesUpper middle incomeUruguayUzbekistanVanuatuVenezuela, RBVietnamVirgin Islands (U.S.)West Bank and GazaWorldYemen, Rep.ZambiaZimbabwe La ligne de temps
Cette échelle de temps montre un graphique de 1961 année à 2016 année Togo. Les données jusqu'à 1960 année ne sont pas présentés. Quantité d'observations actuelles selon dates: 56.
Source (désignation):
Les indicateurs du développement mondiale
Source (organisation):
World Bank national accounts data, and OECD National Accounts data files.
Catégories:
Economy & Growth
Dernière mise à jour
23 avr. 2017
Les indicateurs de changement de valeurs selon les années
Minimum:
121.128 mln.
1 janv. 1961
Maximum:
4.483 mds
1 janv. 2015
Pour la date d''observation
Valeur
Changement absolu
Le changement par rapport à la valeur précédente
1 janv. 1961
121.128 mln.
+121.128 mln.
0.0%
1 janv. 1962
126.396 mln.
+5.268 mln.
4.35%
1 janv. 1963
132.237 mln.
+5.841 mln.
4.62%
1 janv. 1964
143.256 mln.
+11.018 mln.
8.33%
1 janv. 1965
166.104 mln.
+22.848 mln.
15.95%
1 janv. 1966
187.3 mln.
+21.196 mln.
12.76%
1 janv. 1967
216.136 mln.
+28.836 mln.
15.4%
1 janv. 1968
231.706 mln.
+15.57 mln.
7.2%
1 janv. 1969
241.957 mln.
+10.25 mln.
4.42%
1 janv. 1970
267.732 mln.
+25.776 mln.
10.65%
1 janv. 1971
253.977 mln.
-13.756 mln.
-5.14%
1 janv. 1972
286.538 mln.
+32.561 mln.
12.82%
1 janv. 1973
335.678 mln.
+49.14 mln.
17.15%
1 janv. 1974
406.48 mln.
+70.802 mln.
21.09%
1 janv. 1975
560.438 mln.
+153.958 mln.
37.88%
1 janv. 1976
617.322 mln.
+56.884 mln.
10.15%
1 janv. 1977
619.375 mln.
+2.053 mln.
0.33%
1 janv. 1978
777.435 mln.
+158.06 mln.
25.52%
1 janv. 1979
824.264 mln.
+46.829 mln.
6.02%
1 janv. 1980
891.776 mln.
+67.512 mln.
8.19%
1 janv. 1981
1.136 mds
+244.633 mln.
27.43%
1 janv. 1982
962.347 mln.
-174.062 mln.
-15.32%
1 janv. 1983
821.652 mln.
-140.695 mln.
-14.62%
1 janv. 1984
765.747 mln.
-55.905 mln.
-6.8%
1 janv. 1985
718.149 mln.
-47.598 mln.
-6.22%
1 janv. 1986
762.36 mln.
+44.211 mln.
6.16%
1 janv. 1987
1.061 mds
+298.552 mln.
39.16%
1 janv. 1988
1.249 mds
+188.187 mln.
17.74%
1 janv. 1989
1.379 mds
+129.748 mln.
10.39%
1 janv. 1990
1.353 mds
-25.898 mln.
-1.88%
1 janv. 1991
1.628 mds
+275.478 mln.
20.36%
1 janv. 1992
1.602 mds
-26.128 mln.
-1.6%
1 janv. 1993
1.693 mds
+90.659 mln.
5.66%
1 janv. 1994
1.233 mds
-459.462 mln.
-27.14%
1 janv. 1995
982.624 mln.
-250.873 mln.
-20.34%
1 janv. 1996
1.309 mds
+326.759 mln.
33.25%
1 janv. 1997
1.465 mds
+156.065 mln.
11.92%
1 janv. 1998
1.499 mds
+33.503 mln.
2.29%
1 janv. 1999
1.587 mds
+88.395 mln.
5.9%
1 janv. 2000
1.576 mds
-11.251 mln.
-0.71%
1 janv. 2001
1.294 mds
-281.844 mln.
-17.88%
1 janv. 2002
1.332 mds
+38.079 mln.
2.94%
1 janv. 2003
1.475 mds
+142.301 mln.
10.68%
1 janv. 2004
1.674 mds
+199.06 mln.
13.5%
1 janv. 2005
1.937 mds
+263.384 mln.
15.74%
1 janv. 2006
2.115 mds
+178.08 mln.
9.19%
1 janv. 2007
2.203 mds
+87.655 mln.
4.14%
1 janv. 2008
2.523 mds
+320.653 mln.
14.56%
1 janv. 2009
3.163 mds
+639.954 mln.
25.36%
1 janv. 2010
3.163 mds
-415.713 milles
-0.01%
1 janv. 2011
3.173 mds
+9.945 mln.
0.31%
1 janv. 2012
3.756 mds
+583.078 mln.
18.38%
1 janv. 2013
3.867 mds
+110.594 mln.
2.94%
1 janv. 2014
4.081 mds
+214.312 mln.
5.54%
1 janv. 2015
4.483 mds
+401.951 mln.
9.85%
1 janv. 2016
4.088 mds
-394.977 mln.
-8.81%
Classement des pays selon les statistiques actuelles par années


Commentaires: