29
/fr/
fr
AIzaSyAYiBZKx7MnpbEhh9jyipgxe19OcubqV5w
April 1, 2024
238251
Seychelles
SYC
true
2
1
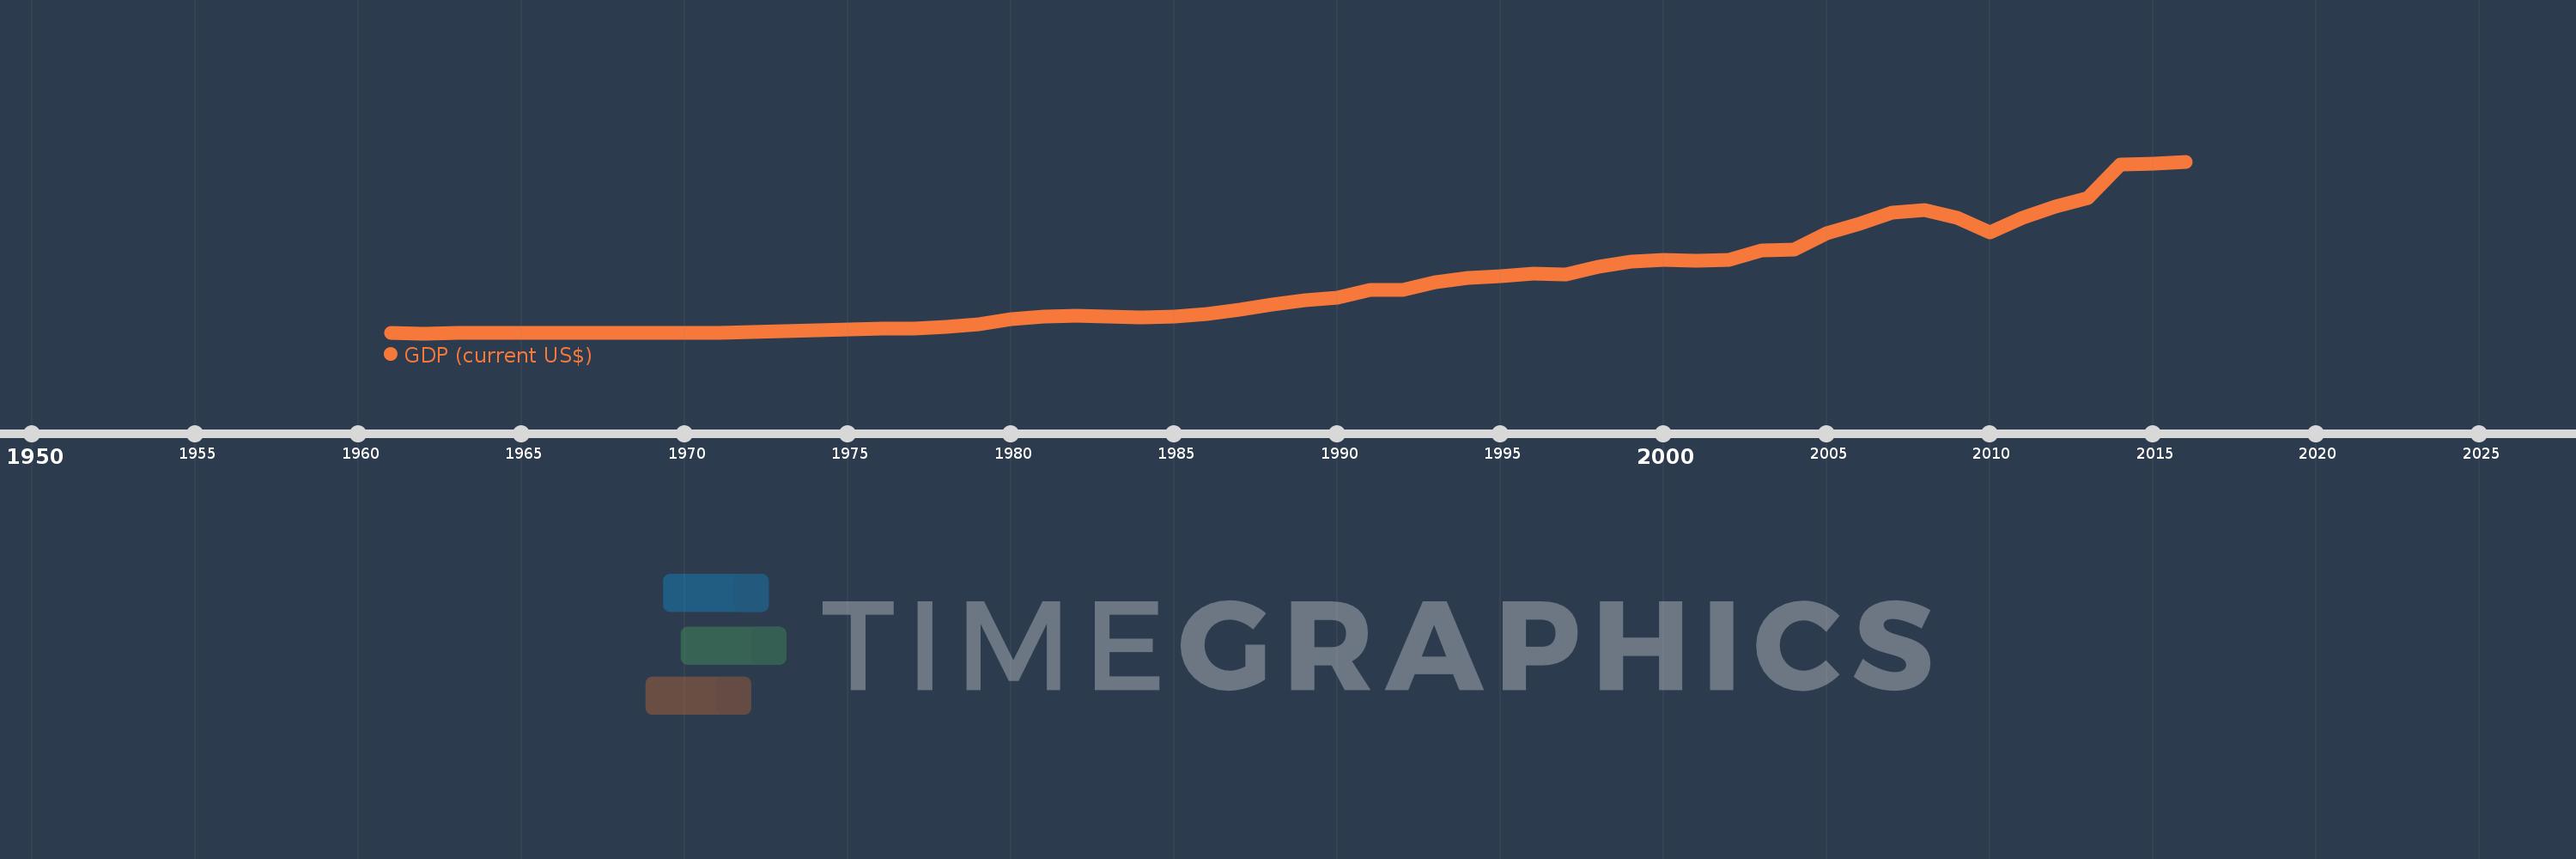
GDP (current US$)
2016,2015,2014,2013,2012,2011,2010,2009,2008,2007,2006,2005,2004,2003,2002,2001,2000,1999,1998,1997,1996,1995,1994,1993,1992,1991,1990,1989,1988,1987,1986,1985,1984,1983,1982,1981,1980,1979,1978,1977,1976,1975,1974,1973,1972,1971,1970,1969,1968,1967,1966,1965,1964,1963,1962,1961
Cette statistique dans les autres pays:
AfghanistanAlbaniaAlgeriaAndorraAngolaAntigua and BarbudaArab WorldArgentinaArmeniaArubaAustraliaAustriaAzerbaijanBahamas, TheBahrainBangladeshBarbadosBelarusBelgiumBelizeBeninBermudaBhutanBoliviaBosnia and HerzegovinaBotswanaBrazilBrunei DarussalamBulgariaBurkina FasoBurundiCabo VerdeCambodiaCameroonCanadaCaribbean small statesCayman IslandsCentral African RepublicCentral Europe and the BalticsChadChannel IslandsChileChinaColombiaComorosCongo, Dem. Rep.Congo, Rep.Costa RicaCote d'IvoireCroatiaCubaCyprusCzech RepublicDenmarkDjiboutiDominicaDominican RepublicEarly-demographic dividendEast Asia & PacificEast Asia & Pacific (excluding high income)East Asia & Pacific (IDA & IBRD countries)EcuadorEgypt, Arab Rep.El SalvadorEquatorial GuineaEritreaEstoniaEthiopiaEuro areaEurope & Central AsiaEurope & Central Asia (excluding high income)Europe & Central Asia (IDA & IBRD countries)European UnionFaroe IslandsFijiFinlandFragile and conflict affected situationsFranceFrench PolynesiaGabonGambia, TheGeorgiaGermanyGhanaGreeceGreenlandGrenadaGuatemalaGuineaGuinea-BissauGuyanaHaitiHeavily indebted poor countries (HIPC)High incomeHondurasHong Kong SAR, ChinaHungaryIBRD onlyIcelandIDA & IBRD totalIDA blendIDA onlyIDA totalIndiaIndonesiaIran, Islamic Rep.IraqIrelandIsle of ManIsraelItalyJamaicaJapanJordanKazakhstanKenyaKiribatiKorea, Rep.KosovoKuwaitKyrgyz RepublicLao PDRLate-demographic dividendLatin America & Caribbean Latin America & Caribbean (excluding high income)Latin America & the Caribbean (IDA & IBRD countries)LatviaLeast developed countries: UN classificationLebanonLesothoLiberiaLibyaLiechtensteinLithuaniaLow & middle incomeLow incomeLower middle incomeLuxembourgMacao SAR, ChinaMacedonia, FYRMadagascarMalawiMalaysiaMaldivesMaliMaltaMarshall IslandsMauritaniaMauritiusMexicoMicronesia, Fed. Sts.Middle East & North AfricaMiddle East & North Africa (excluding high income)Middle East & North Africa (IDA & IBRD countries)Middle incomeMoldovaMonacoMongoliaMontenegroMoroccoMozambiqueMyanmarNamibiaNauruNepalNetherlandsNew CaledoniaNew ZealandNicaraguaNigerNigeriaNorth AmericaNorwayOECD membersOmanOther small statesPacific island small statesPakistanPalauPanamaPapua New GuineaParaguayPeruPhilippinesPolandPortugalPost-demographic dividendPre-demographic dividendPuerto RicoQatarRomaniaRussian FederationRwandaSamoaSan MarinoSao Tome and PrincipeSaudi ArabiaSenegalSerbiaSeychellesSierra LeoneSingaporeSlovak RepublicSloveniaSmall statesSolomon IslandsSomaliaSouth AfricaSouth AsiaSouth Asia (IDA & IBRD)South SudanSpainSri LankaSt. Kitts and NevisSt. LuciaSt. Vincent and the GrenadinesSub-Saharan Africa Sub-Saharan Africa (excluding high income)Sub-Saharan Africa (IDA & IBRD countries)SudanSurinameSwazilandSwedenSwitzerlandSyrian Arab RepublicTajikistanTanzaniaThailandTimor-LesteTogoTongaTrinidad and TobagoTunisiaTurkeyTurkmenistanTuvaluUgandaUkraineUnited Arab EmiratesUnited KingdomUnited StatesUpper middle incomeUruguayUzbekistanVanuatuVenezuela, RBVietnamVirgin Islands (U.S.)West Bank and GazaWorldYemen, Rep.ZambiaZimbabwe La ligne de temps
Cette échelle de temps montre un graphique de 1961 année à 2016 année Seychelles. Les données jusqu'à 1960 année ne sont pas présentés. Quantité d'observations actuelles selon dates: 56.
Source (désignation):
Les indicateurs du développement mondiale
Source (organisation):
World Bank national accounts data, and OECD National Accounts data files.
Catégories:
Economy & Growth
Dernière mise à jour
23 avr. 2017
Les indicateurs de changement de valeurs selon les années
Minimum:
11.592 mln.
1 janv. 1962
Maximum:
1.438 mds
1 janv. 2016
Pour la date d''observation
Valeur
Changement absolu
Le changement par rapport à la valeur précédente
1 janv. 1961
12.012 mln.
+12.012 mln.
0.0%
1 janv. 1962
11.592 mln.
-420.001 milles
-3.5%
1 janv. 1963
12.642 mln.
+1.05 mln.
9.06%
1 janv. 1964
13.923 mln.
+1.281 mln.
10.13%
1 janv. 1965
15.393 mln.
+1.47 mln.
10.56%
1 janv. 1966
15.603 mln.
+210.0 milles
1.36%
1 janv. 1967
16.443 mln.
+840.002 milles
5.38%
1 janv. 1968
16.632 mln.
+188.998 milles
1.15%
1 janv. 1969
16.074 mln.
-558.005 milles
-3.36%
1 janv. 1970
16.452 mln.
+378.001 milles
2.35%
1 janv. 1971
18.432 mln.
+1.98 mln.
12.04%
1 janv. 1972
21.966 mln.
+3.534 mln.
19.17%
1 janv. 1973
30.645 mln.
+8.679 mln.
39.51%
1 janv. 1974
36.896 mln.
+6.251 mln.
20.4%
1 janv. 1975
43.134 mln.
+6.238 mln.
16.91%
1 janv. 1976
47.803 mln.
+4.669 mln.
10.82%
1 janv. 1977
49.279 mln.
+1.476 mln.
3.09%
1 janv. 1978
64.526 mln.
+15.247 mln.
30.94%
1 janv. 1979
85.552 mln.
+21.026 mln.
32.59%
1 janv. 1980
127.261 mln.
+41.709 mln.
48.75%
1 janv. 1981
147.357 mln.
+20.096 mln.
15.79%
1 janv. 1982
154.903 mln.
+7.546 mln.
5.12%
1 janv. 1983
147.912 mln.
-6.991 mln.
-4.51%
1 janv. 1984
146.713 mln.
-1.199 mln.
-0.81%
1 janv. 1985
151.313 mln.
+4.6 mln.
3.14%
1 janv. 1986
168.888 mln.
+17.574 mln.
11.61%
1 janv. 1987
207.851 mln.
+38.963 mln.
23.07%
1 janv. 1988
249.267 mln.
+41.416 mln.
19.93%
1 janv. 1989
283.829 mln.
+34.562 mln.
13.87%
1 janv. 1990
304.833 mln.
+21.004 mln.
7.4%
1 janv. 1991
368.585 mln.
+63.752 mln.
20.91%
1 janv. 1992
374.36 mln.
+5.775 mln.
1.57%
1 janv. 1993
433.667 mln.
+59.308 mln.
15.84%
1 janv. 1994
473.917 mln.
+40.25 mln.
9.28%
1 janv. 1995
486.451 mln.
+12.534 mln.
2.64%
1 janv. 1996
508.222 mln.
+21.77 mln.
4.48%
1 janv. 1997
503.068 mln.
-5.153 mln.
-1.01%
1 janv. 1998
562.959 mln.
+59.89 mln.
11.91%
1 janv. 1999
608.369 mln.
+45.41 mln.
8.07%
1 janv. 2000
622.985 mln.
+14.616 mln.
2.4%
1 janv. 2001
614.88 mln.
-8.106 mln.
-1.3%
1 janv. 2002
622.262 mln.
+7.382 mln.
1.2%
1 janv. 2003
697.518 mln.
+75.256 mln.
12.09%
1 janv. 2004
705.705 mln.
+8.187 mln.
1.17%
1 janv. 2005
839.32 mln.
+133.615 mln.
18.93%
1 janv. 2006
919.103 mln.
+79.783 mln.
9.51%
1 janv. 2007
1.016 mds
+97.315 mln.
10.59%
1 janv. 2008
1.034 mds
+17.143 mln.
1.69%
1 janv. 2009
967.2 mln.
-66.362 mln.
-6.42%
1 janv. 2010
847.398 mln.
-119.802 mln.
-12.39%
1 janv. 2011
969.937 mln.
+122.539 mln.
14.46%
1 janv. 2012
1.066 mds
+95.89 mln.
9.89%
1 janv. 2013
1.134 mds
+68.441 mln.
6.42%
1 janv. 2014
1.411 mds
+276.794 mln.
24.4%
1 janv. 2015
1.423 mds
+11.47 mln.
0.81%
1 janv. 2016
1.438 mds
+15.191 mln.
1.07%
Classement des pays selon les statistiques actuelles par années


Commentaires: