29
/fr/
fr
AIzaSyAYiBZKx7MnpbEhh9jyipgxe19OcubqV5w
April 1, 2024
136718
Gambia, The
GMB
true
2
1
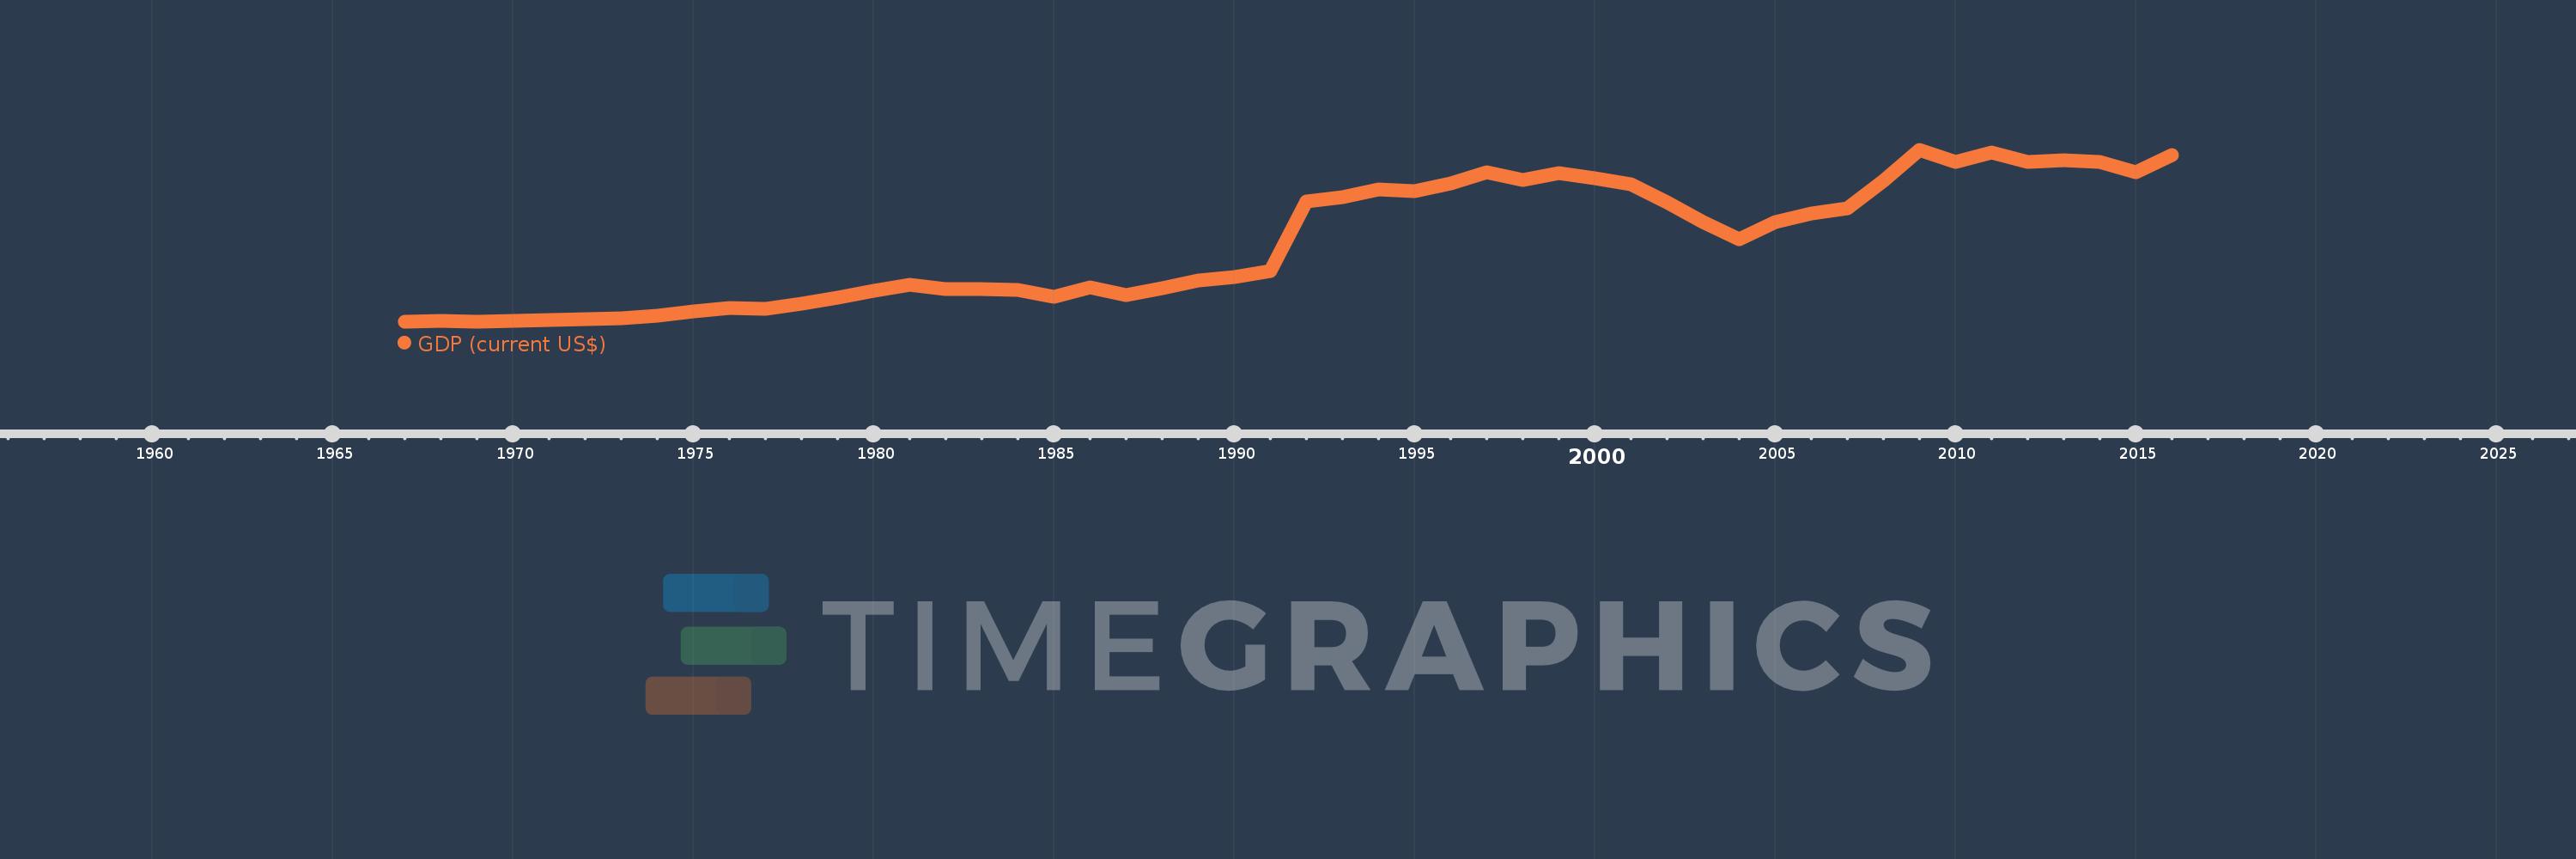
GDP (current US$)
2016,2015,2014,2013,2012,2011,2010,2009,2008,2007,2006,2005,2004,2003,2002,2001,2000,1999,1998,1997,1996,1995,1994,1993,1992,1991,1990,1989,1988,1987,1986,1985,1984,1983,1982,1981,1980,1979,1978,1977,1976,1975,1974,1973,1972,1971,1970,1969,1968,1967
Cette statistique dans les autres pays:
AfghanistanAlbaniaAlgeriaAndorraAngolaAntigua and BarbudaArab WorldArgentinaArmeniaArubaAustraliaAustriaAzerbaijanBahamas, TheBahrainBangladeshBarbadosBelarusBelgiumBelizeBeninBermudaBhutanBoliviaBosnia and HerzegovinaBotswanaBrazilBrunei DarussalamBulgariaBurkina FasoBurundiCabo VerdeCambodiaCameroonCanadaCaribbean small statesCayman IslandsCentral African RepublicCentral Europe and the BalticsChadChannel IslandsChileChinaColombiaComorosCongo, Dem. Rep.Congo, Rep.Costa RicaCote d'IvoireCroatiaCubaCyprusCzech RepublicDenmarkDjiboutiDominicaDominican RepublicEarly-demographic dividendEast Asia & PacificEast Asia & Pacific (excluding high income)East Asia & Pacific (IDA & IBRD countries)EcuadorEgypt, Arab Rep.El SalvadorEquatorial GuineaEritreaEstoniaEthiopiaEuro areaEurope & Central AsiaEurope & Central Asia (excluding high income)Europe & Central Asia (IDA & IBRD countries)European UnionFaroe IslandsFijiFinlandFragile and conflict affected situationsFranceFrench PolynesiaGabonGambia, TheGeorgiaGermanyGhanaGreeceGreenlandGrenadaGuatemalaGuineaGuinea-BissauGuyanaHaitiHeavily indebted poor countries (HIPC)High incomeHondurasHong Kong SAR, ChinaHungaryIBRD onlyIcelandIDA & IBRD totalIDA blendIDA onlyIDA totalIndiaIndonesiaIran, Islamic Rep.IraqIrelandIsle of ManIsraelItalyJamaicaJapanJordanKazakhstanKenyaKiribatiKorea, Rep.KosovoKuwaitKyrgyz RepublicLao PDRLate-demographic dividendLatin America & Caribbean Latin America & Caribbean (excluding high income)Latin America & the Caribbean (IDA & IBRD countries)LatviaLeast developed countries: UN classificationLebanonLesothoLiberiaLibyaLiechtensteinLithuaniaLow & middle incomeLow incomeLower middle incomeLuxembourgMacao SAR, ChinaMacedonia, FYRMadagascarMalawiMalaysiaMaldivesMaliMaltaMarshall IslandsMauritaniaMauritiusMexicoMicronesia, Fed. Sts.Middle East & North AfricaMiddle East & North Africa (excluding high income)Middle East & North Africa (IDA & IBRD countries)Middle incomeMoldovaMonacoMongoliaMontenegroMoroccoMozambiqueMyanmarNamibiaNauruNepalNetherlandsNew CaledoniaNew ZealandNicaraguaNigerNigeriaNorth AmericaNorwayOECD membersOmanOther small statesPacific island small statesPakistanPalauPanamaPapua New GuineaParaguayPeruPhilippinesPolandPortugalPost-demographic dividendPre-demographic dividendPuerto RicoQatarRomaniaRussian FederationRwandaSamoaSan MarinoSao Tome and PrincipeSaudi ArabiaSenegalSerbiaSeychellesSierra LeoneSingaporeSlovak RepublicSloveniaSmall statesSolomon IslandsSomaliaSouth AfricaSouth AsiaSouth Asia (IDA & IBRD)South SudanSpainSri LankaSt. Kitts and NevisSt. LuciaSt. Vincent and the GrenadinesSub-Saharan Africa Sub-Saharan Africa (excluding high income)Sub-Saharan Africa (IDA & IBRD countries)SudanSurinameSwazilandSwedenSwitzerlandSyrian Arab RepublicTajikistanTanzaniaThailandTimor-LesteTogoTongaTrinidad and TobagoTunisiaTurkeyTurkmenistanTuvaluUgandaUkraineUnited Arab EmiratesUnited KingdomUnited StatesUpper middle incomeUruguayUzbekistanVanuatuVenezuela, RBVietnamVirgin Islands (U.S.)West Bank and GazaWorldYemen, Rep.ZambiaZimbabwe La ligne de temps
Cette échelle de temps montre un graphique de 1967 année à 2016 année Gambia, The. Les données jusqu'à 1966 année ne sont pas présentés. Quantité d'observations actuelles selon dates: 50.
Source (désignation):
Les indicateurs du développement mondiale
Source (organisation):
World Bank national accounts data, and OECD National Accounts data files.
Catégories:
Economy & Growth
Dernière mise à jour
23 avr. 2017
Les indicateurs de changement de valeurs selon les années
Minimum:
41.161 mln.
1 janv. 1969
Maximum:
965.769 mln.
1 janv. 2009
Pour la date d''observation
Valeur
Changement absolu
Le changement par rapport à la valeur précédente
1 janv. 1967
44.212 mln.
+44.212 mln.
0.0%
1 janv. 1968
46.695 mln.
+2.483 mln.
5.62%
1 janv. 1969
41.161 mln.
-5.535 mln.
-11.85%
1 janv. 1970
45.169 mln.
+4.008 mln.
9.74%
1 janv. 1971
52.297 mln.
+7.128 mln.
15.78%
1 janv. 1972
55.729 mln.
+3.432 mln.
6.56%
1 janv. 1973
59.162 mln.
+3.433 mln.
6.16%
1 janv. 1974
75.188 mln.
+16.026 mln.
27.09%
1 janv. 1975
95.798 mln.
+20.61 mln.
27.41%
1 janv. 1976
115.183 mln.
+19.385 mln.
20.24%
1 janv. 1977
112.189 mln.
-2.993 mln.
-2.6%
1 janv. 1978
138.094 mln.
+25.905 mln.
23.09%
1 janv. 1979
171.837 mln.
+33.743 mln.
24.43%
1 janv. 1980
207.114 mln.
+35.278 mln.
20.53%
1 janv. 1981
241.081 mln.
+33.966 mln.
16.4%
1 janv. 1982
218.764 mln.
-22.316 mln.
-9.26%
1 janv. 1983
216.051 mln.
-2.713 mln.
-1.24%
1 janv. 1984
213.447 mln.
-2.605 mln.
-1.21%
1 janv. 1985
177.339 mln.
-36.108 mln.
-16.92%
1 janv. 1986
225.725 mln.
+48.386 mln.
27.28%
1 janv. 1987
185.646 mln.
-40.079 mln.
-17.76%
1 janv. 1988
220.626 mln.
+34.98 mln.
18.84%
1 janv. 1989
266.673 mln.
+46.047 mln.
20.87%
1 janv. 1990
284.12 mln.
+17.447 mln.
6.54%
1 janv. 1991
317.083 mln.
+32.964 mln.
11.6%
1 janv. 1992
690.314 mln.
+373.231 mln.
117.71%
1 janv. 1993
714.255 mln.
+23.941 mln.
3.47%
1 janv. 1994
755.043 mln.
+40.787 mln.
5.71%
1 janv. 1995
746.492 mln.
-8.551 mln.
-1.13%
1 janv. 1996
785.997 mln.
+39.505 mln.
5.29%
1 janv. 1997
848.237 mln.
+62.24 mln.
7.92%
1 janv. 1998
803.631 mln.
-44.606 mln.
-5.26%
1 janv. 1999
840.285 mln.
+36.655 mln.
4.56%
1 janv. 2000
814.723 mln.
-25.562 mln.
-3.04%
1 janv. 2001
782.915 mln.
-31.808 mln.
-3.9%
1 janv. 2002
687.409 mln.
-95.507 mln.
-12.2%
1 janv. 2003
578.236 mln.
-109.173 mln.
-15.88%
1 janv. 2004
487.039 mln.
-91.197 mln.
-15.77%
1 janv. 2005
578.785 mln.
+91.746 mln.
18.84%
1 janv. 2006
624.175 mln.
+45.389 mln.
7.84%
1 janv. 2007
655.069 mln.
+30.894 mln.
4.95%
1 janv. 2008
798.871 mln.
+143.802 mln.
21.95%
1 janv. 2009
965.769 mln.
+166.898 mln.
20.89%
1 janv. 2010
900.64 mln.
-65.129 mln.
-6.74%
1 janv. 2011
952.429 mln.
+51.789 mln.
5.75%
1 janv. 2012
904.257 mln.
-48.172 mln.
-5.06%
1 janv. 2013
912.57 mln.
+8.313 mln.
0.92%
1 janv. 2014
903.779 mln.
-8.79 mln.
-0.96%
1 janv. 2015
849.123 mln.
-54.657 mln.
-6.05%
1 janv. 2016
938.795 mln.
+89.672 mln.
10.56%
Classement des pays selon les statistiques actuelles par années


Commentaires: