29
/fr/
fr
AIzaSyAYiBZKx7MnpbEhh9jyipgxe19OcubqV5w
April 1, 2024
93443
Bulgaria
BGR
true
2
1
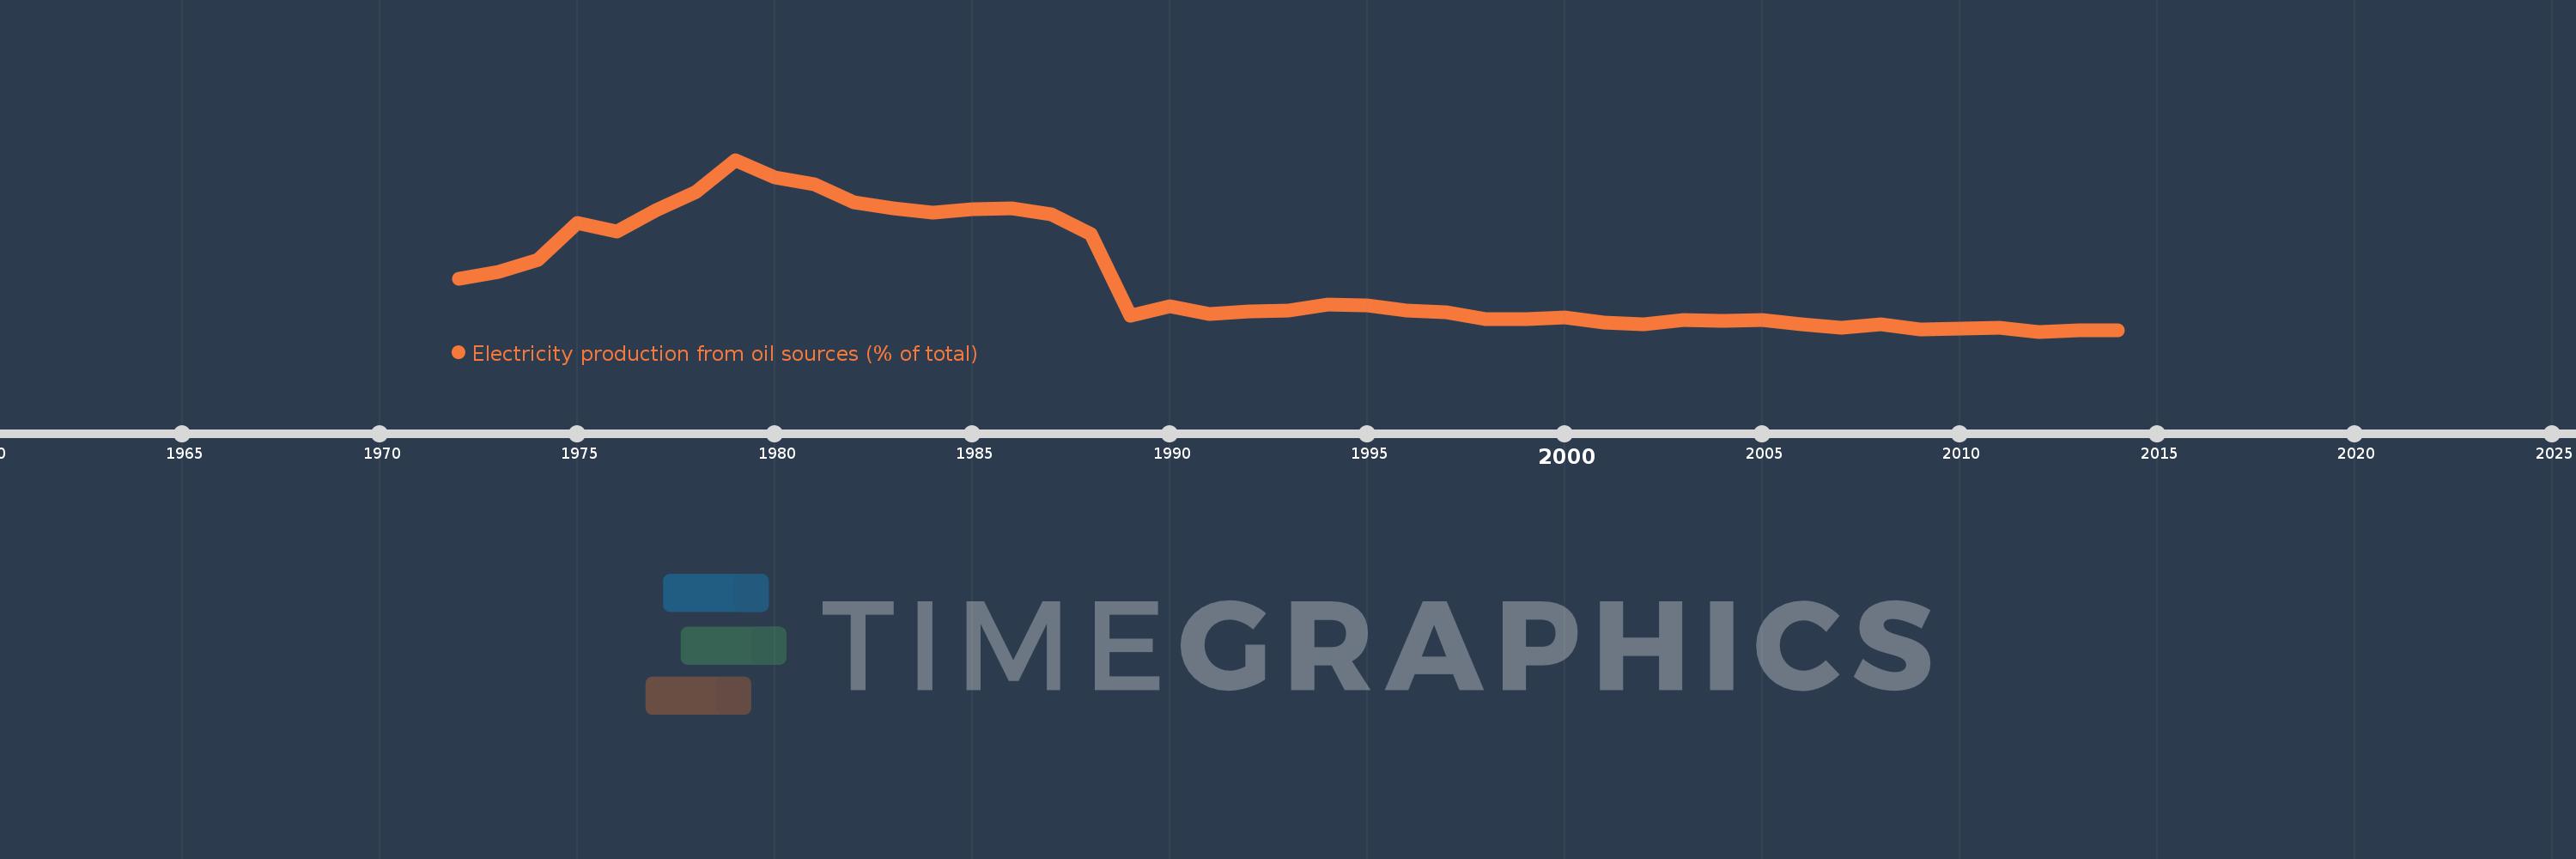
Electricity production from oil sources (% of total)
2014,2013,2012,2011,2010,2009,2008,2007,2006,2005,2004,2003,2002,2001,2000,1999,1998,1997,1996,1995,1994,1993,1992,1991,1990,1989,1988,1987,1986,1985,1984,1983,1982,1981,1980,1979,1978,1977,1976,1975,1974,1973,1972
Cette statistique dans les autres pays:
AlbaniaAlgeriaAngolaArab WorldArgentinaArmeniaAustraliaAustriaAzerbaijanBahrainBangladeshBelarusBelgiumBeninBoliviaBosnia and HerzegovinaBotswanaBrazilBrunei DarussalamBulgariaCambodiaCameroonCanadaCentral Europe and the BalticsChileChinaColombiaCongo, Dem. Rep.Congo, Rep.Costa RicaCote d'IvoireCroatiaCubaCuracaoCyprusCzech RepublicDenmarkDominican RepublicEarly-demographic dividendEast Asia & PacificEast Asia & Pacific (excluding high income)East Asia & Pacific (IDA & IBRD countries)EcuadorEgypt, Arab Rep.El SalvadorEritreaEstoniaEthiopiaEuro areaEurope & Central AsiaEurope & Central Asia (excluding high income)Europe & Central Asia (IDA & IBRD countries)European UnionFinlandFragile and conflict affected situationsFranceGabonGeorgiaGermanyGhanaGibraltarGreeceGuatemalaHaitiHeavily indebted poor countries (HIPC)High incomeHondurasHong Kong SAR, ChinaHungaryIBRD onlyIcelandIDA & IBRD totalIDA blendIDA onlyIDA totalIndiaIndonesiaIran, Islamic Rep.IraqIrelandIsraelItalyJamaicaJapanJordanKazakhstanKenyaKorea, Dem. People’s Rep.Korea, Rep.KosovoKuwaitKyrgyz RepublicLate-demographic dividendLatin America & Caribbean Latin America & Caribbean (excluding high income)Latin America & the Caribbean (IDA & IBRD countries)LatviaLeast developed countries: UN classificationLebanonLibyaLithuaniaLow & middle incomeLower middle incomeLuxembourgMacedonia, FYRMalaysiaMaltaMauritiusMexicoMiddle East & North AfricaMiddle East & North Africa (excluding high income)Middle East & North Africa (IDA & IBRD countries)Middle incomeMoldovaMongoliaMontenegroMoroccoMozambiqueMyanmarNamibiaNepalNetherlandsNew ZealandNicaraguaNigerNigeriaNorth AmericaNorwayOECD membersOmanOther small statesPakistanPanamaParaguayPeruPhilippinesPolandPortugalPost-demographic dividendPre-demographic dividendQatarRomaniaRussian FederationSaudi ArabiaSenegalSerbiaSingaporeSlovak RepublicSloveniaSmall statesSouth AfricaSouth AsiaSouth Asia (IDA & IBRD)South SudanSpainSri LankaSub-Saharan Africa Sub-Saharan Africa (excluding high income)Sub-Saharan Africa (IDA & IBRD countries)SudanSwedenSwitzerlandSyrian Arab RepublicTajikistanTanzaniaThailandTogoTrinidad and TobagoTunisiaTurkeyTurkmenistanUkraineUnited Arab EmiratesUnited KingdomUnited StatesUpper middle incomeUruguayUzbekistanVenezuela, RBVietnamWorldYemen, Rep.ZambiaZimbabwe La ligne de temps
Cette échelle de temps montre un graphique de 1972 année à 2014 année Bulgaria. Les données jusqu'à 1971 année ne sont pas présentés. Quantité d'observations actuelles selon dates: 43.
Source (désignation):
Les indicateurs du développement mondiale
Source (organisation):
IEA Statistics © OECD/IEA 2014 (http://www.iea.org/stats/index.asp), subject to https://www.iea.org/t&c/termsandconditions/
Catégories:
Energy & Mining, Climate Change, Infrastructure
Dernière mise à jour
23 avr. 2017
Les indicateurs de changement de valeurs selon les années
Minimum:
0.274
1 janv. 2012
Maximum:
26.13
1 janv. 1979
Pour la date d''observation
Valeur
Changement absolu
Le changement par rapport à la valeur précédente
1 janv. 1972
8.17
+8.17
0.0%
1 janv. 1973
9.205
+1.035
12.67%
1 janv. 1974
11.017
+1.813
19.69%
1 janv. 1975
16.654
+5.636
51.16%
1 janv. 1976
15.287
-1.366
-8.21%
1 janv. 1977
18.611
+3.324
21.74%
1 janv. 1978
21.289
+2.678
14.39%
1 janv. 1979
26.13
+4.841
22.74%
1 janv. 1980
23.424
-2.706
-10.36%
1 janv. 1981
22.492
-0.933
-3.98%
1 janv. 1982
19.758
-2.734
-12.15%
1 janv. 1983
18.864
-0.895
-4.53%
1 janv. 1984
18.195
-0.668
-3.54%
1 janv. 1985
18.636
+0.44
2.42%
1 janv. 1986
18.817
+0.181
0.97%
1 janv. 1987
17.874
-0.943
-5.01%
1 janv. 1988
14.95
-2.925
-16.36%
1 janv. 1989
2.723
-12.226
-81.78%
1 janv. 1990
4.128
+1.405
51.6%
1 janv. 1991
2.919
-1.21
-29.3%
1 janv. 1992
3.309
+0.39
13.36%
1 janv. 1993
3.406
+0.098
2.95%
1 janv. 1994
4.327
+0.92
27.02%
1 janv. 1995
4.264
-0.063
-1.45%
1 janv. 1996
3.453
-0.811
-19.02%
1 janv. 1997
3.125
-0.328
-9.49%
1 janv. 1998
2.173
-0.953
-30.48%
1 janv. 1999
2.182
+0.009
0.41%
1 janv. 2000
2.438
+0.257
11.76%
1 janv. 2001
1.626
-0.812
-33.3%
1 janv. 2002
1.33
-0.296
-18.22%
1 janv. 2003
1.968
+0.638
47.99%
1 janv. 2004
1.864
-0.104
-5.3%
1 janv. 2005
1.984
+0.12
6.45%
1 janv. 2006
1.378
-0.606
-30.55%
1 janv. 2007
0.833
-0.545
-39.56%
1 janv. 2008
1.323
+0.49
58.82%
1 janv. 2009
0.621
-0.702
-53.03%
1 janv. 2010
0.774
+0.153
24.57%
1 janv. 2011
0.854
+0.08
10.35%
1 janv. 2012
0.274
-0.58
-67.93%
1 janv. 2013
0.472
+0.198
72.46%
1 janv. 2014
0.525
+0.052
11.1%
Classement des pays selon les statistiques actuelles par années


Commentaires: