29
/fr/
fr
AIzaSyAYiBZKx7MnpbEhh9jyipgxe19OcubqV5w
April 1, 2024
25606
Central Europe and the Baltics
CEB
false
2
1
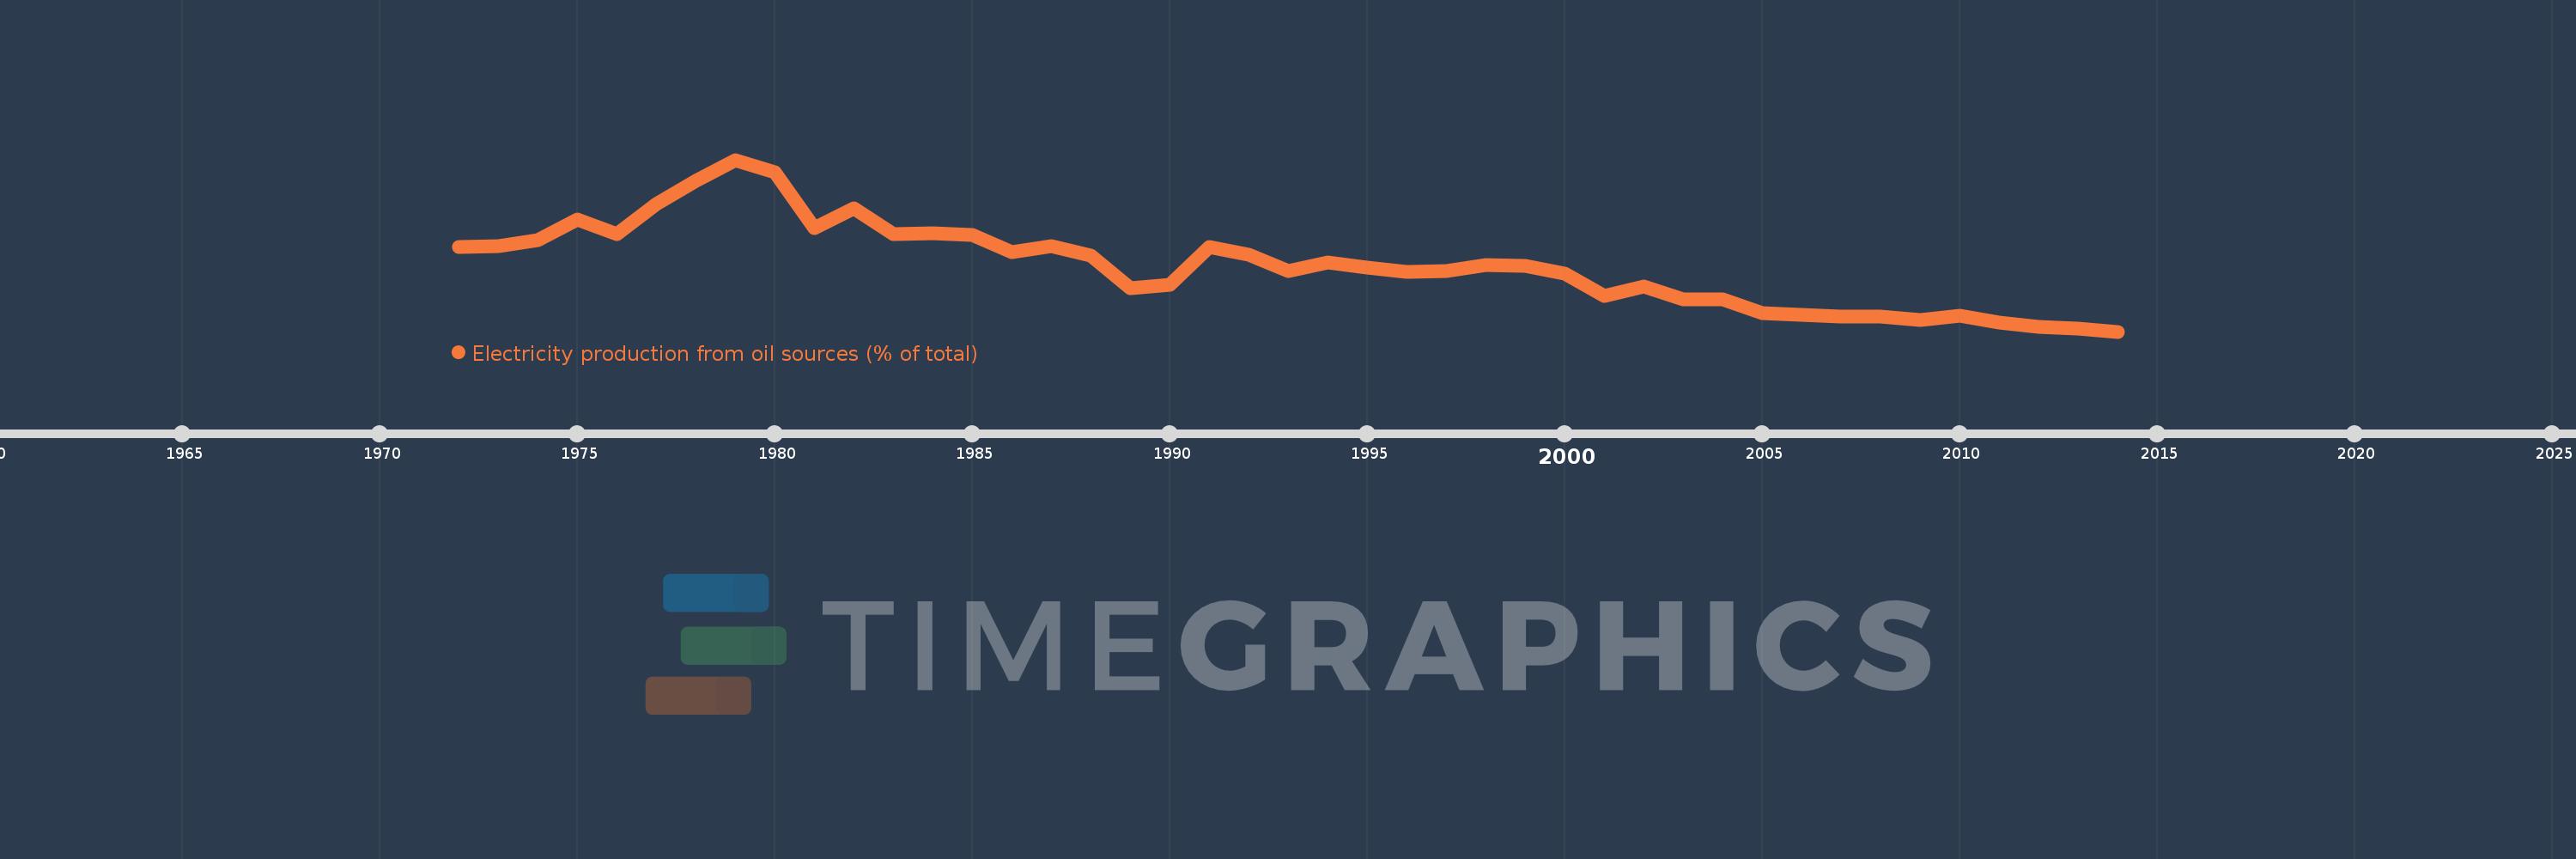
Electricity production from oil sources (% of total)
2014,2013,2012,2011,2010,2009,2008,2007,2006,2005,2004,2003,2002,2001,2000,1999,1998,1997,1996,1995,1994,1993,1992,1991,1990,1989,1988,1987,1986,1985,1984,1983,1982,1981,1980,1979,1978,1977,1976,1975,1974,1973,1972
Cette statistique dans les autres pays:
AlbaniaAlgeriaAngolaArab WorldArgentinaArmeniaAustraliaAustriaAzerbaijanBahrainBangladeshBelarusBelgiumBeninBoliviaBosnia and HerzegovinaBotswanaBrazilBrunei DarussalamBulgariaCambodiaCameroonCanadaCentral Europe and the BalticsChileChinaColombiaCongo, Dem. Rep.Congo, Rep.Costa RicaCote d'IvoireCroatiaCubaCuracaoCyprusCzech RepublicDenmarkDominican RepublicEarly-demographic dividendEast Asia & PacificEast Asia & Pacific (excluding high income)East Asia & Pacific (IDA & IBRD countries)EcuadorEgypt, Arab Rep.El SalvadorEritreaEstoniaEthiopiaEuro areaEurope & Central AsiaEurope & Central Asia (excluding high income)Europe & Central Asia (IDA & IBRD countries)European UnionFinlandFragile and conflict affected situationsFranceGabonGeorgiaGermanyGhanaGibraltarGreeceGuatemalaHaitiHeavily indebted poor countries (HIPC)High incomeHondurasHong Kong SAR, ChinaHungaryIBRD onlyIcelandIDA & IBRD totalIDA blendIDA onlyIDA totalIndiaIndonesiaIran, Islamic Rep.IraqIrelandIsraelItalyJamaicaJapanJordanKazakhstanKenyaKorea, Dem. People’s Rep.Korea, Rep.KosovoKuwaitKyrgyz RepublicLate-demographic dividendLatin America & Caribbean Latin America & Caribbean (excluding high income)Latin America & the Caribbean (IDA & IBRD countries)LatviaLeast developed countries: UN classificationLebanonLibyaLithuaniaLow & middle incomeLower middle incomeLuxembourgMacedonia, FYRMalaysiaMaltaMauritiusMexicoMiddle East & North AfricaMiddle East & North Africa (excluding high income)Middle East & North Africa (IDA & IBRD countries)Middle incomeMoldovaMongoliaMontenegroMoroccoMozambiqueMyanmarNamibiaNepalNetherlandsNew ZealandNicaraguaNigerNigeriaNorth AmericaNorwayOECD membersOmanOther small statesPakistanPanamaParaguayPeruPhilippinesPolandPortugalPost-demographic dividendPre-demographic dividendQatarRomaniaRussian FederationSaudi ArabiaSenegalSerbiaSingaporeSlovak RepublicSloveniaSmall statesSouth AfricaSouth AsiaSouth Asia (IDA & IBRD)South SudanSpainSri LankaSub-Saharan Africa Sub-Saharan Africa (excluding high income)Sub-Saharan Africa (IDA & IBRD countries)SudanSwedenSwitzerlandSyrian Arab RepublicTajikistanTanzaniaThailandTogoTrinidad and TobagoTunisiaTurkeyTurkmenistanUkraineUnited Arab EmiratesUnited KingdomUnited StatesUpper middle incomeUruguayUzbekistanVenezuela, RBVietnamWorldYemen, Rep.ZambiaZimbabwe La ligne de temps
Cette échelle de temps montre un graphique de 1972 année à 2014 année Central Europe and the Baltics. Les données jusqu'à 1971 année ne sont pas présentés. Quantité d'observations actuelles selon dates: 43.
Source (désignation):
Les indicateurs du développement mondiale
Source (organisation):
IEA Statistics © OECD/IEA 2014 (http://www.iea.org/stats/index.asp), subject to https://www.iea.org/t&c/termsandconditions/
Catégories:
Energy & Mining, Climate Change, Infrastructure
Dernière mise à jour
23 avr. 2017
Les indicateurs de changement de valeurs selon les années
Minimum:
0.794
1 janv. 2014
Maximum:
12.329
1 janv. 1979
Pour la date d''observation
Valeur
Changement absolu
Le changement par rapport à la valeur précédente
1 janv. 1972
6.478
+6.478
0.0%
1 janv. 1973
6.553
+0.075
1.16%
1 janv. 1974
6.937
+0.385
5.87%
1 janv. 1975
8.295
+1.358
19.57%
1 janv. 1976
7.357
-0.938
-11.31%
1 janv. 1977
9.365
+2.008
27.29%
1 janv. 1978
10.898
+1.533
16.37%
1 janv. 1979
12.329
+1.43
13.12%
1 janv. 1980
11.517
-0.812
-6.58%
1 janv. 1981
7.72
-3.796
-32.96%
1 janv. 1982
9.086
+1.365
17.69%
1 janv. 1983
7.364
-1.721
-18.94%
1 janv. 1984
7.421
+0.056
0.76%
1 janv. 1985
7.288
-0.133
-1.79%
1 janv. 1986
6.116
-1.171
-16.07%
1 janv. 1987
6.507
+0.391
6.39%
1 janv. 1988
5.92
-0.587
-9.02%
1 janv. 1989
3.705
-2.215
-37.42%
1 janv. 1990
3.914
+0.21
5.66%
1 janv. 1991
6.499
+2.585
66.03%
1 janv. 1992
5.962
-0.537
-8.27%
1 janv. 1993
4.859
-1.103
-18.5%
1 janv. 1994
5.449
+0.59
12.15%
1 janv. 1995
5.112
-0.337
-6.18%
1 janv. 1996
4.831
-0.282
-5.51%
1 janv. 1997
4.846
+0.015
0.32%
1 janv. 1998
5.237
+0.391
8.07%
1 janv. 1999
5.19
-0.048
-0.91%
1 janv. 2000
4.673
-0.517
-9.96%
1 janv. 2001
3.189
-1.484
-31.76%
1 janv. 2002
3.817
+0.629
19.72%
1 janv. 2003
2.936
-0.882
-23.1%
1 janv. 2004
2.928
-0.008
-0.26%
1 janv. 2005
2.047
-0.881
-30.1%
1 janv. 2006
1.915
-0.132
-6.45%
1 janv. 2007
1.825
-0.09
-4.7%
1 janv. 2008
1.783
-0.042
-2.29%
1 janv. 2009
1.576
-0.206
-11.58%
1 janv. 2010
1.838
+0.261
16.58%
1 janv. 2011
1.383
-0.454
-24.72%
1 janv. 2012
1.094
-0.289
-20.92%
1 janv. 2013
1.005
-0.089
-8.11%
1 janv. 2014
0.794
-0.211
-21.02%
Classement des pays selon les statistiques actuelles par années


Commentaires: