29
/fr/
fr
AIzaSyAYiBZKx7MnpbEhh9jyipgxe19OcubqV5w
April 1, 2024
228358
Romania
ROU
true
2
1
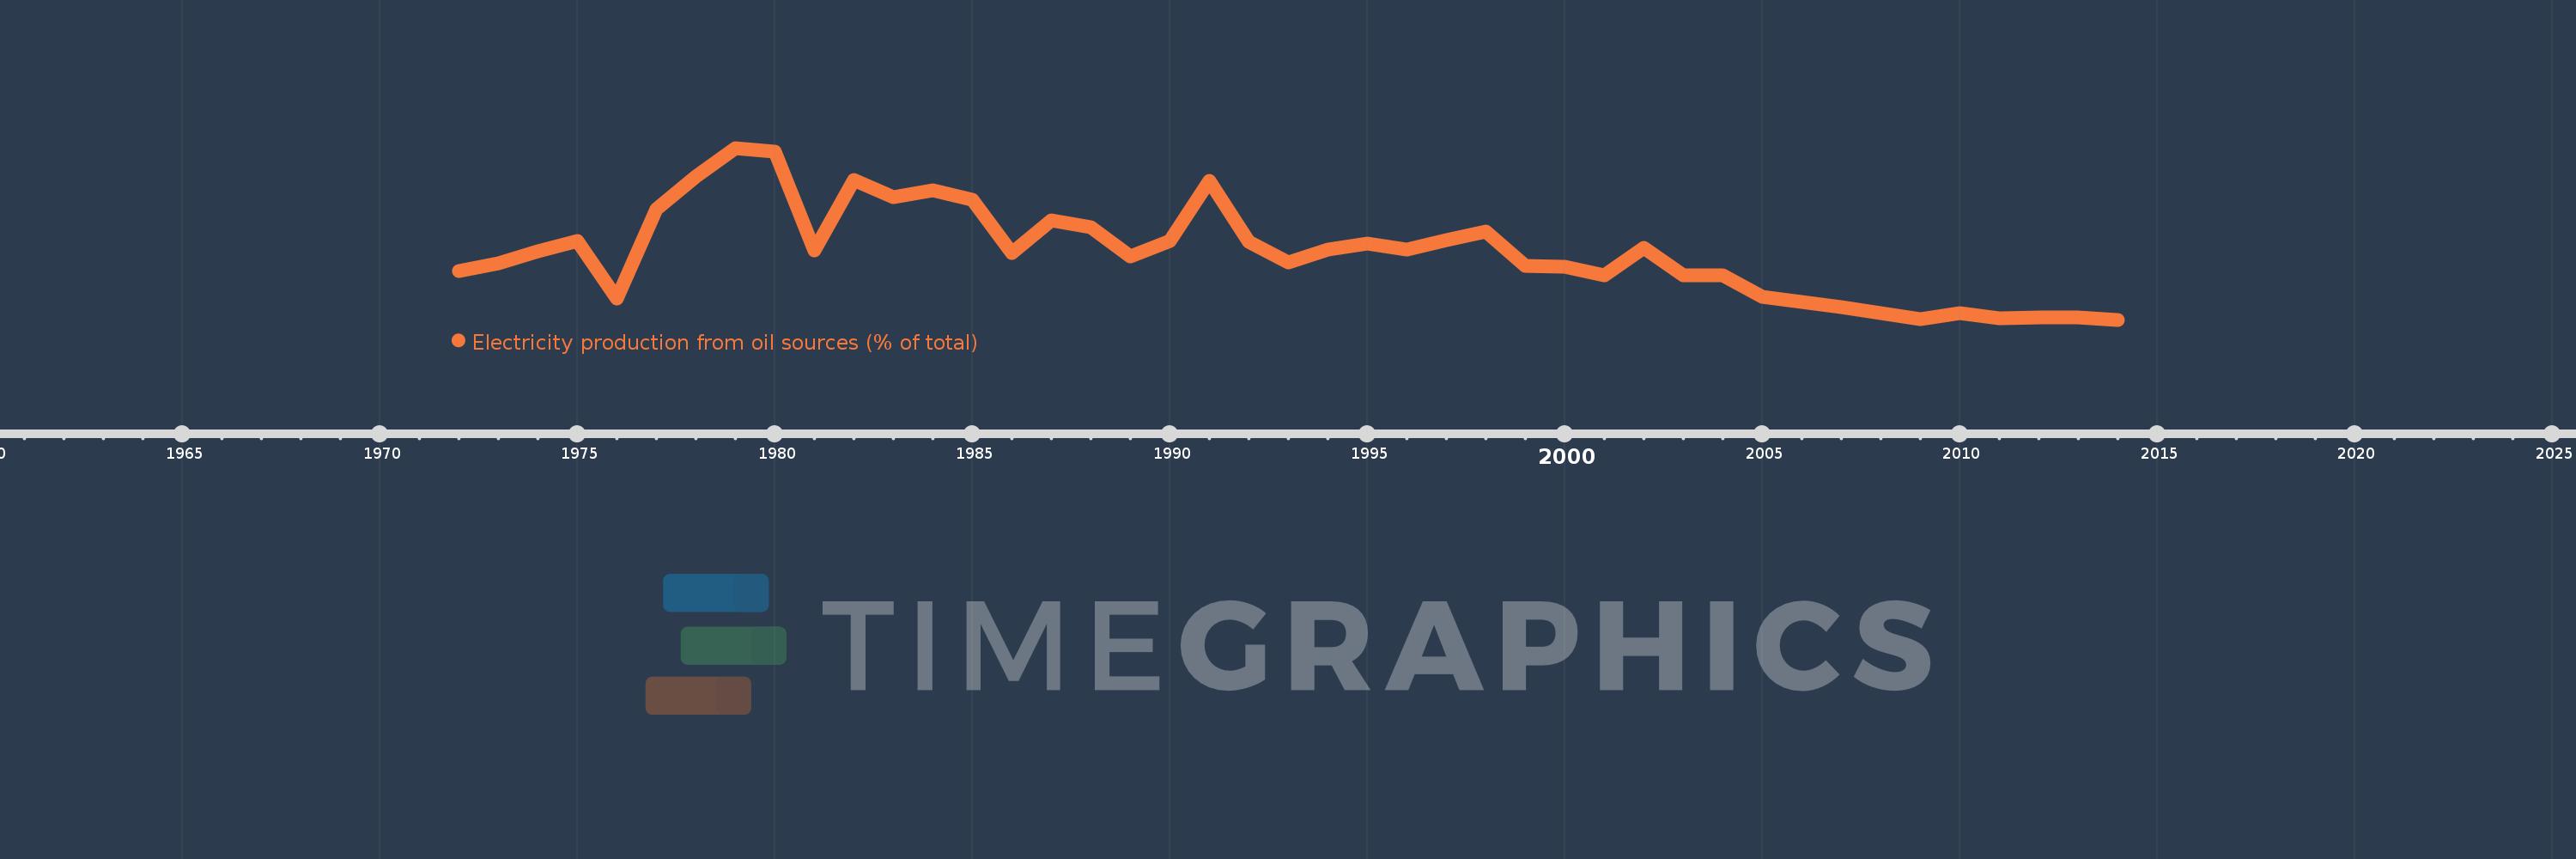
Electricity production from oil sources (% of total)
2014,2013,2012,2011,2010,2009,2008,2007,2006,2005,2004,2003,2002,2001,2000,1999,1998,1997,1996,1995,1994,1993,1992,1991,1990,1989,1988,1987,1986,1985,1984,1983,1982,1981,1980,1979,1978,1977,1976,1975,1974,1973,1972
Cette statistique dans les autres pays:
AlbaniaAlgeriaAngolaArab WorldArgentinaArmeniaAustraliaAustriaAzerbaijanBahrainBangladeshBelarusBelgiumBeninBoliviaBosnia and HerzegovinaBotswanaBrazilBrunei DarussalamBulgariaCambodiaCameroonCanadaCentral Europe and the BalticsChileChinaColombiaCongo, Dem. Rep.Congo, Rep.Costa RicaCote d'IvoireCroatiaCubaCuracaoCyprusCzech RepublicDenmarkDominican RepublicEarly-demographic dividendEast Asia & PacificEast Asia & Pacific (excluding high income)East Asia & Pacific (IDA & IBRD countries)EcuadorEgypt, Arab Rep.El SalvadorEritreaEstoniaEthiopiaEuro areaEurope & Central AsiaEurope & Central Asia (excluding high income)Europe & Central Asia (IDA & IBRD countries)European UnionFinlandFragile and conflict affected situationsFranceGabonGeorgiaGermanyGhanaGibraltarGreeceGuatemalaHaitiHeavily indebted poor countries (HIPC)High incomeHondurasHong Kong SAR, ChinaHungaryIBRD onlyIcelandIDA & IBRD totalIDA blendIDA onlyIDA totalIndiaIndonesiaIran, Islamic Rep.IraqIrelandIsraelItalyJamaicaJapanJordanKazakhstanKenyaKorea, Dem. People’s Rep.Korea, Rep.KosovoKuwaitKyrgyz RepublicLate-demographic dividendLatin America & Caribbean Latin America & Caribbean (excluding high income)Latin America & the Caribbean (IDA & IBRD countries)LatviaLeast developed countries: UN classificationLebanonLibyaLithuaniaLow & middle incomeLower middle incomeLuxembourgMacedonia, FYRMalaysiaMaltaMauritiusMexicoMiddle East & North AfricaMiddle East & North Africa (excluding high income)Middle East & North Africa (IDA & IBRD countries)Middle incomeMoldovaMongoliaMontenegroMoroccoMozambiqueMyanmarNamibiaNepalNetherlandsNew ZealandNicaraguaNigerNigeriaNorth AmericaNorwayOECD membersOmanOther small statesPakistanPanamaParaguayPeruPhilippinesPolandPortugalPost-demographic dividendPre-demographic dividendQatarRomaniaRussian FederationSaudi ArabiaSenegalSerbiaSingaporeSlovak RepublicSloveniaSmall statesSouth AfricaSouth AsiaSouth Asia (IDA & IBRD)South SudanSpainSri LankaSub-Saharan Africa Sub-Saharan Africa (excluding high income)Sub-Saharan Africa (IDA & IBRD countries)SudanSwedenSwitzerlandSyrian Arab RepublicTajikistanTanzaniaThailandTogoTrinidad and TobagoTunisiaTurkeyTurkmenistanUkraineUnited Arab EmiratesUnited KingdomUnited StatesUpper middle incomeUruguayUzbekistanVenezuela, RBVietnamWorldYemen, Rep.ZambiaZimbabwe La ligne de temps
Cette échelle de temps montre un graphique de 1972 année à 2014 année Romania. Les données jusqu'à 1971 année ne sont pas présentés. Quantité d'observations actuelles selon dates: 43.
Source (désignation):
Les indicateurs du développement mondiale
Source (organisation):
IEA Statistics © OECD/IEA 2014 (http://www.iea.org/stats/index.asp), subject to https://www.iea.org/t&c/termsandconditions/
Catégories:
Energy & Mining, Climate Change, Infrastructure
Dernière mise à jour
23 avr. 2017
Les indicateurs de changement de valeurs selon les années
Minimum:
0.957
1 janv. 2014
Maximum:
22.576
1 janv. 1979
Pour la date d''observation
Valeur
Changement absolu
Le changement par rapport à la valeur précédente
1 janv. 1972
7.046
+7.046
0.0%
1 janv. 1973
8.09
+1.043
14.81%
1 janv. 1974
9.556
+1.466
18.12%
1 janv. 1975
10.819
+1.263
13.22%
1 janv. 1976
3.587
-7.232
-66.84%
1 janv. 1977
14.889
+11.302
315.07%
1 janv. 1978
18.972
+4.083
27.42%
1 janv. 1979
22.576
+3.604
19.0%
1 janv. 1980
22.129
-0.447
-1.98%
1 janv. 1981
9.635
-12.494
-56.46%
1 janv. 1982
18.573
+8.939
92.78%
1 janv. 1983
16.343
-2.23
-12.01%
1 janv. 1984
17.284
+0.941
5.76%
1 janv. 1985
16.039
-1.245
-7.2%
1 janv. 1986
9.409
-6.631
-41.34%
1 janv. 1987
13.517
+4.108
43.66%
1 janv. 1988
12.586
-0.931
-6.89%
1 janv. 1989
8.894
-3.692
-29.33%
1 janv. 1990
10.921
+2.028
22.8%
1 janv. 1991
18.385
+7.463
68.34%
1 janv. 1992
10.799
-7.586
-41.26%
1 janv. 1993
8.204
-2.595
-24.03%
1 janv. 1994
9.795
+1.592
19.4%
1 janv. 1995
10.494
+0.699
7.13%
1 janv. 1996
9.785
-0.709
-6.76%
1 janv. 1997
10.926
+1.141
11.66%
1 janv. 1998
12.009
+1.083
9.92%
1 janv. 1999
7.739
-4.27
-35.56%
1 janv. 2000
7.602
-0.137
-1.77%
1 janv. 2001
6.545
-1.057
-13.91%
1 janv. 2002
10.034
+3.489
53.31%
1 janv. 2003
6.537
-3.497
-34.85%
1 janv. 2004
6.589
+0.052
0.79%
1 janv. 2005
3.892
-2.697
-40.93%
1 janv. 2006
3.188
-0.704
-18.09%
1 janv. 2007
2.562
-0.626
-19.65%
1 janv. 2008
1.777
-0.784
-30.62%
1 janv. 2009
1.078
-0.699
-39.36%
1 janv. 2010
1.786
+0.708
65.69%
1 janv. 2011
1.142
-0.644
-36.07%
1 janv. 2012
1.24
+0.099
8.65%
1 janv. 2013
1.278
+0.037
3.02%
1 janv. 2014
0.957
-0.321
-25.13%
Classement des pays selon les statistiques actuelles par années


Commentaires: