29
/fr/
fr
AIzaSyAYiBZKx7MnpbEhh9jyipgxe19OcubqV5w
April 1, 2024
207836
Netherlands
NLD
true
2
1
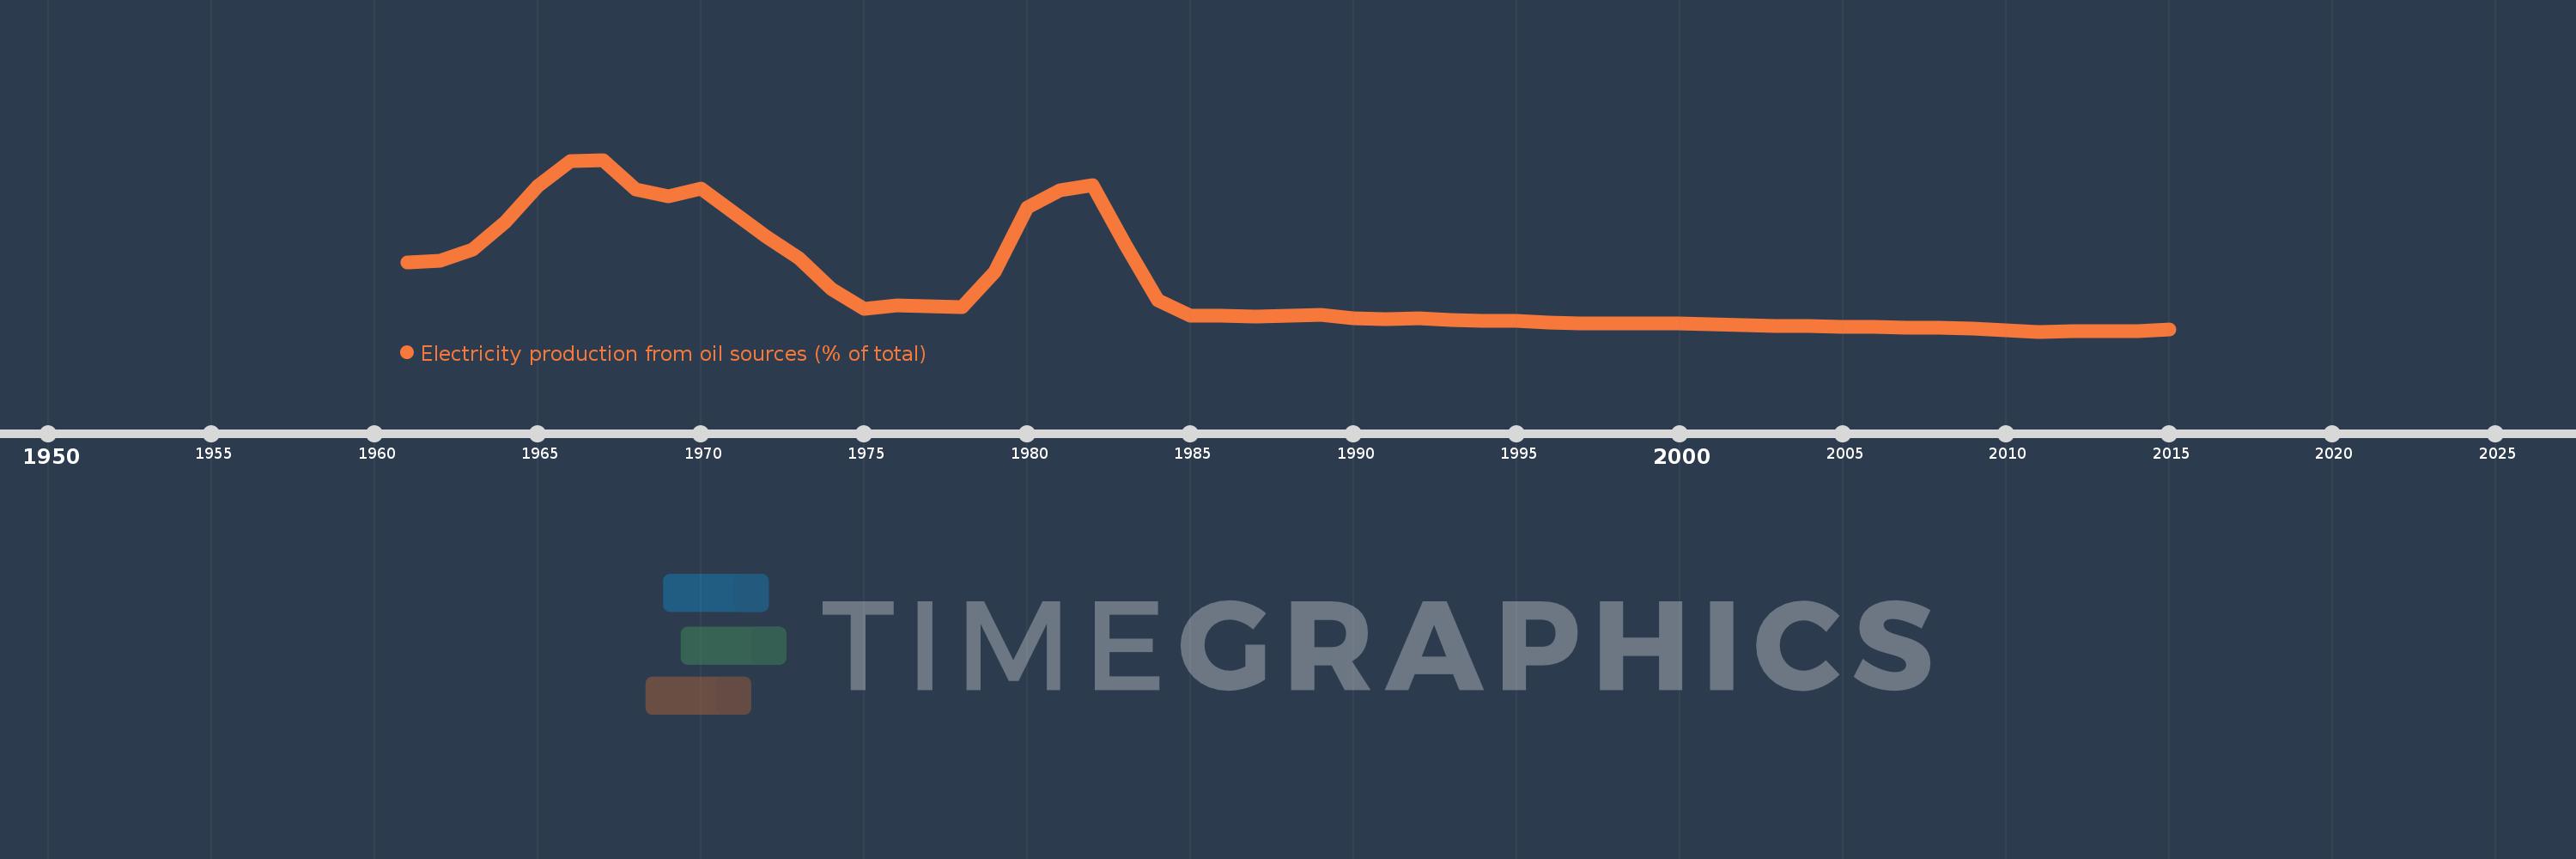
Electricity production from oil sources (% of total)
2015,2014,2013,2012,2011,2010,2009,2008,2007,2006,2005,2004,2003,2002,2001,2000,1999,1998,1997,1996,1995,1994,1993,1992,1991,1990,1989,1988,1987,1986,1985,1984,1983,1982,1981,1980,1979,1978,1977,1976,1975,1974,1973,1972,1971,1970,1969,1968,1967,1966,1965,1964,1963,1962,1961
Cette statistique dans les autres pays:
AlbaniaAlgeriaAngolaArab WorldArgentinaArmeniaAustraliaAustriaAzerbaijanBahrainBangladeshBelarusBelgiumBeninBoliviaBosnia and HerzegovinaBotswanaBrazilBrunei DarussalamBulgariaCambodiaCameroonCanadaCentral Europe and the BalticsChileChinaColombiaCongo, Dem. Rep.Congo, Rep.Costa RicaCote d'IvoireCroatiaCubaCuracaoCyprusCzech RepublicDenmarkDominican RepublicEarly-demographic dividendEast Asia & PacificEast Asia & Pacific (excluding high income)East Asia & Pacific (IDA & IBRD countries)EcuadorEgypt, Arab Rep.El SalvadorEritreaEstoniaEthiopiaEuro areaEurope & Central AsiaEurope & Central Asia (excluding high income)Europe & Central Asia (IDA & IBRD countries)European UnionFinlandFragile and conflict affected situationsFranceGabonGeorgiaGermanyGhanaGibraltarGreeceGuatemalaHaitiHeavily indebted poor countries (HIPC)High incomeHondurasHong Kong SAR, ChinaHungaryIBRD onlyIcelandIDA & IBRD totalIDA blendIDA onlyIDA totalIndiaIndonesiaIran, Islamic Rep.IraqIrelandIsraelItalyJamaicaJapanJordanKazakhstanKenyaKorea, Dem. People’s Rep.Korea, Rep.KosovoKuwaitKyrgyz RepublicLate-demographic dividendLatin America & Caribbean Latin America & Caribbean (excluding high income)Latin America & the Caribbean (IDA & IBRD countries)LatviaLeast developed countries: UN classificationLebanonLibyaLithuaniaLow & middle incomeLower middle incomeLuxembourgMacedonia, FYRMalaysiaMaltaMauritiusMexicoMiddle East & North AfricaMiddle East & North Africa (excluding high income)Middle East & North Africa (IDA & IBRD countries)Middle incomeMoldovaMongoliaMontenegroMoroccoMozambiqueMyanmarNamibiaNepalNetherlandsNew ZealandNicaraguaNigerNigeriaNorth AmericaNorwayOECD membersOmanOther small statesPakistanPanamaParaguayPeruPhilippinesPolandPortugalPost-demographic dividendPre-demographic dividendQatarRomaniaRussian FederationSaudi ArabiaSenegalSerbiaSingaporeSlovak RepublicSloveniaSmall statesSouth AfricaSouth AsiaSouth Asia (IDA & IBRD)South SudanSpainSri LankaSub-Saharan Africa Sub-Saharan Africa (excluding high income)Sub-Saharan Africa (IDA & IBRD countries)SudanSwedenSwitzerlandSyrian Arab RepublicTajikistanTanzaniaThailandTogoTrinidad and TobagoTunisiaTurkeyTurkmenistanUkraineUnited Arab EmiratesUnited KingdomUnited StatesUpper middle incomeUruguayUzbekistanVenezuela, RBVietnamWorldYemen, Rep.ZambiaZimbabwe La ligne de temps
Cette échelle de temps montre un graphique de 1961 année à 2015 année Netherlands. Les données jusqu'à 1960 année ne sont pas présentés. Quantité d'observations actuelles selon dates: 55.
Source (désignation):
Les indicateurs du développement mondiale
Source (organisation):
IEA Statistics © OECD/IEA 2014 (http://www.iea.org/stats/index.asp), subject to https://www.iea.org/t&c/termsandconditions/
Catégories:
Energy & Mining, Climate Change, Infrastructure
Dernière mise à jour
23 avr. 2017
Les indicateurs de changement de valeurs selon les années
Minimum:
1.061
1 janv. 2011
Maximum:
46.597
1 janv. 1967
Pour la date d''observation
Valeur
Changement absolu
Le changement par rapport à la valeur précédente
1 janv. 1961
19.424
+19.424
0.0%
1 janv. 1962
19.944
+0.521
2.68%
1 janv. 1963
22.882
+2.938
14.73%
1 janv. 1964
30.123
+7.241
31.64%
1 janv. 1965
39.595
+9.472
31.45%
1 janv. 1966
46.202
+6.606
16.68%
1 janv. 1967
46.597
+0.395
0.86%
1 janv. 1968
38.841
-7.756
-16.64%
1 janv. 1969
36.991
-1.85
-4.76%
1 janv. 1970
39.045
+2.054
5.55%
1 janv. 1971
32.603
-6.442
-16.5%
1 janv. 1972
26.223
-6.381
-19.57%
1 janv. 1973
20.526
-5.696
-21.72%
1 janv. 1974
12.328
-8.198
-39.94%
1 janv. 1975
7.162
-5.166
-41.91%
1 janv. 1976
7.936
+0.774
10.81%
1 janv. 1977
7.875
-0.062
-0.78%
1 janv. 1978
7.527
-0.348
-4.42%
1 janv. 1979
16.909
+9.382
124.65%
1 janv. 1980
33.862
+16.954
100.27%
1 janv. 1981
38.421
+4.559
13.46%
1 janv. 1982
39.862
+1.441
3.75%
1 janv. 1983
24.071
-15.791
-39.61%
1 janv. 1984
9.467
-14.605
-60.67%
1 janv. 1985
5.359
-4.108
-43.4%
1 janv. 1986
5.176
-0.183
-3.41%
1 janv. 1987
5.146
-0.03
-0.57%
1 janv. 1988
5.348
+0.202
3.92%
1 janv. 1989
5.453
+0.105
1.97%
1 janv. 1990
4.527
-0.926
-16.98%
1 janv. 1991
4.326
-0.201
-4.44%
1 janv. 1992
4.543
+0.217
5.02%
1 janv. 1993
4.218
-0.325
-7.15%
1 janv. 1994
3.99
-0.229
-5.42%
1 janv. 1995
3.87
-0.119
-2.98%
1 janv. 1996
3.517
-0.354
-9.14%
1 janv. 1997
3.31
-0.207
-5.87%
1 janv. 1998
3.256
-0.054
-1.64%
1 janv. 1999
3.307
+0.051
1.56%
1 janv. 2000
3.207
-0.1
-3.02%
1 janv. 2001
2.947
-0.26
-8.12%
1 janv. 2002
2.825
-0.122
-4.13%
1 janv. 2003
2.463
-0.362
-12.81%
1 janv. 2004
2.575
+0.112
4.54%
1 janv. 2005
2.373
-0.202
-7.83%
1 janv. 2006
2.257
-0.116
-4.89%
1 janv. 2007
2.129
-0.128
-5.66%
1 janv. 2008
2.11
-0.019
-0.9%
1 janv. 2009
1.918
-0.192
-9.09%
1 janv. 2010
1.31
-0.608
-31.71%
1 janv. 2011
1.061
-0.25
-19.04%
1 janv. 2012
1.287
+0.226
21.35%
1 janv. 2013
1.066
-0.221
-17.16%
1 janv. 2014
1.237
+0.171
16.03%
1 janv. 2015
1.575
+0.337
27.27%
Classement des pays selon les statistiques actuelles par années


Commentaires: