29
/fr/
fr
AIzaSyAYiBZKx7MnpbEhh9jyipgxe19OcubqV5w
April 1, 2024
210248
Nicaragua
NIC
true
2
1
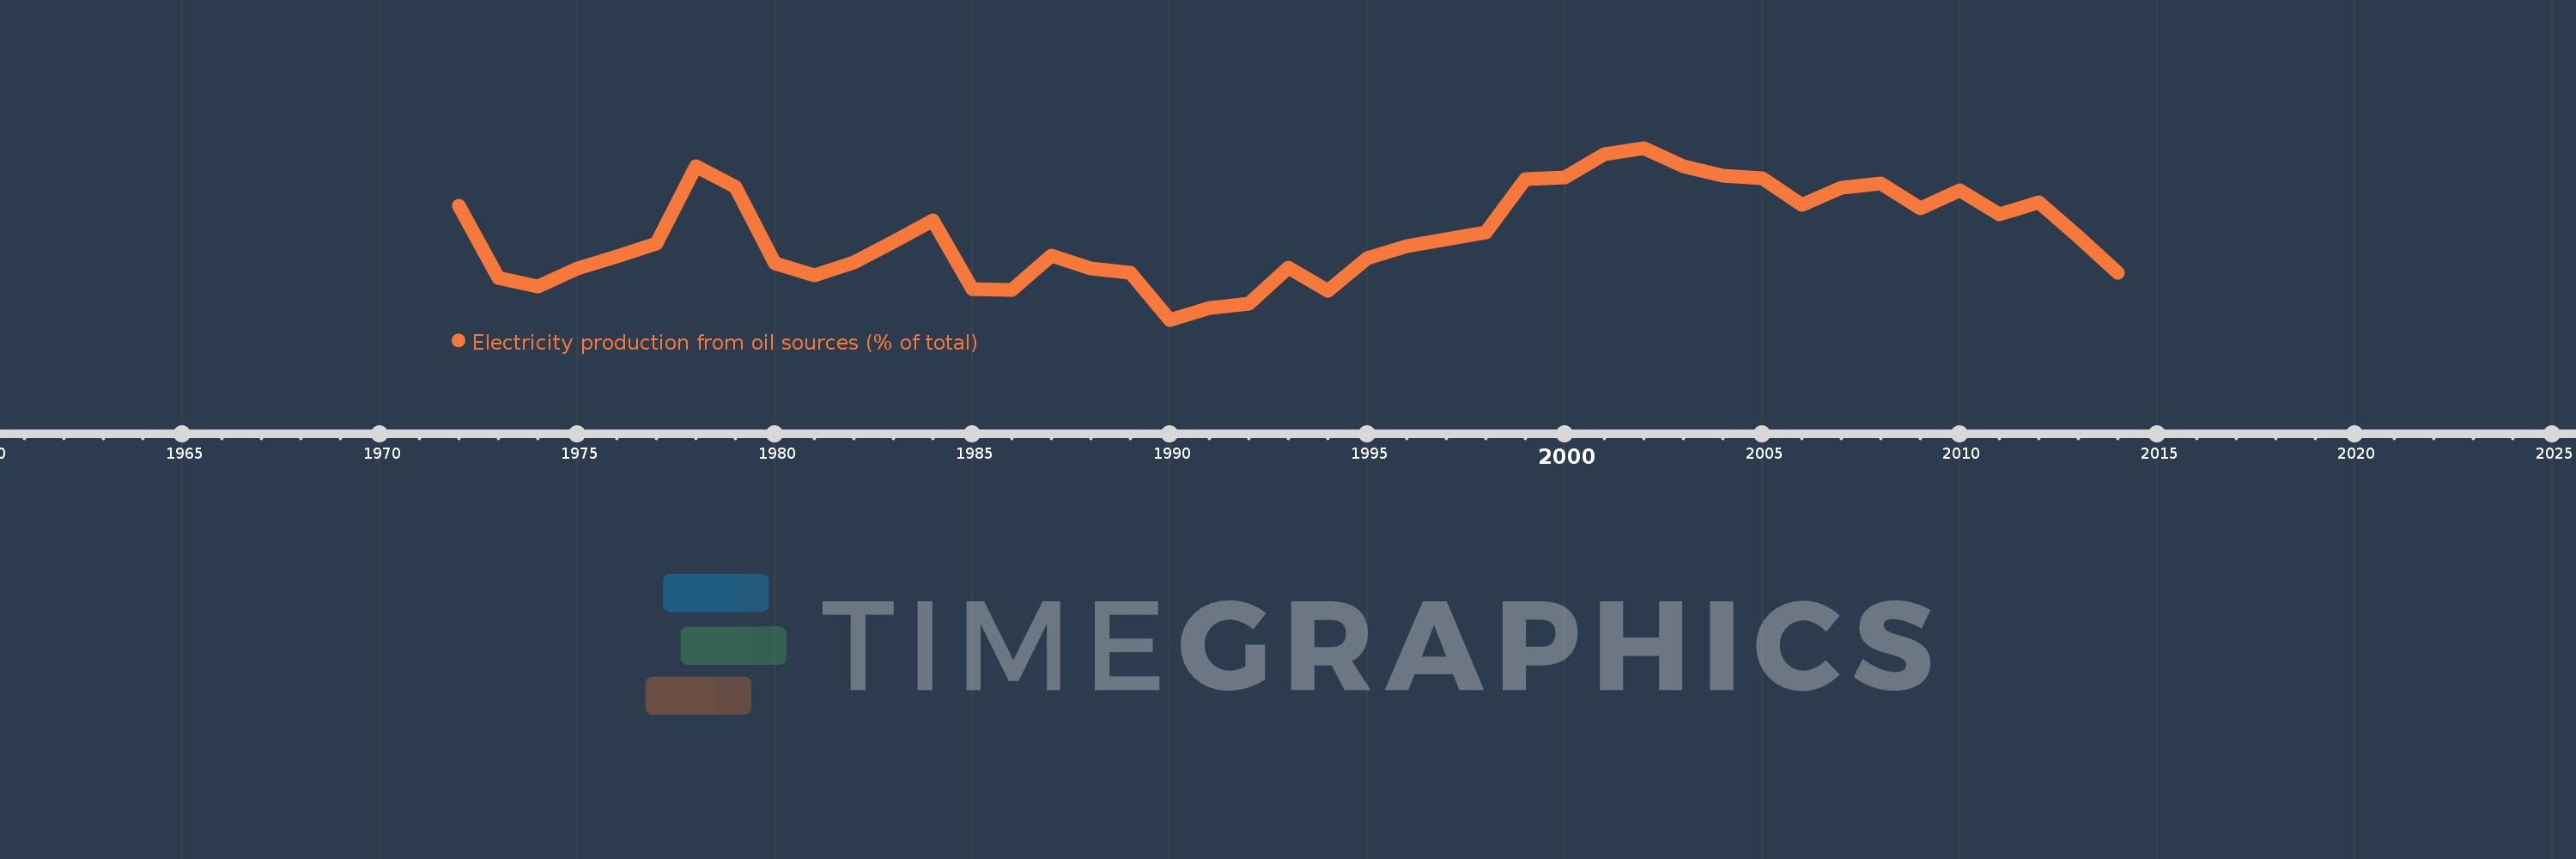
Electricity production from oil sources (% of total)
2014,2013,2012,2011,2010,2009,2008,2007,2006,2005,2004,2003,2002,2001,2000,1999,1998,1997,1996,1995,1994,1993,1992,1991,1990,1989,1988,1987,1986,1985,1984,1983,1982,1981,1980,1979,1978,1977,1976,1975,1974,1973,1972
Cette statistique dans les autres pays:
AlbaniaAlgeriaAngolaArab WorldArgentinaArmeniaAustraliaAustriaAzerbaijanBahrainBangladeshBelarusBelgiumBeninBoliviaBosnia and HerzegovinaBotswanaBrazilBrunei DarussalamBulgariaCambodiaCameroonCanadaCentral Europe and the BalticsChileChinaColombiaCongo, Dem. Rep.Congo, Rep.Costa RicaCote d'IvoireCroatiaCubaCuracaoCyprusCzech RepublicDenmarkDominican RepublicEarly-demographic dividendEast Asia & PacificEast Asia & Pacific (excluding high income)East Asia & Pacific (IDA & IBRD countries)EcuadorEgypt, Arab Rep.El SalvadorEritreaEstoniaEthiopiaEuro areaEurope & Central AsiaEurope & Central Asia (excluding high income)Europe & Central Asia (IDA & IBRD countries)European UnionFinlandFragile and conflict affected situationsFranceGabonGeorgiaGermanyGhanaGibraltarGreeceGuatemalaHaitiHeavily indebted poor countries (HIPC)High incomeHondurasHong Kong SAR, ChinaHungaryIBRD onlyIcelandIDA & IBRD totalIDA blendIDA onlyIDA totalIndiaIndonesiaIran, Islamic Rep.IraqIrelandIsraelItalyJamaicaJapanJordanKazakhstanKenyaKorea, Dem. People’s Rep.Korea, Rep.KosovoKuwaitKyrgyz RepublicLate-demographic dividendLatin America & Caribbean Latin America & Caribbean (excluding high income)Latin America & the Caribbean (IDA & IBRD countries)LatviaLeast developed countries: UN classificationLebanonLibyaLithuaniaLow & middle incomeLower middle incomeLuxembourgMacedonia, FYRMalaysiaMaltaMauritiusMexicoMiddle East & North AfricaMiddle East & North Africa (excluding high income)Middle East & North Africa (IDA & IBRD countries)Middle incomeMoldovaMongoliaMontenegroMoroccoMozambiqueMyanmarNamibiaNepalNetherlandsNew ZealandNicaraguaNigerNigeriaNorth AmericaNorwayOECD membersOmanOther small statesPakistanPanamaParaguayPeruPhilippinesPolandPortugalPost-demographic dividendPre-demographic dividendQatarRomaniaRussian FederationSaudi ArabiaSenegalSerbiaSingaporeSlovak RepublicSloveniaSmall statesSouth AfricaSouth AsiaSouth Asia (IDA & IBRD)South SudanSpainSri LankaSub-Saharan Africa Sub-Saharan Africa (excluding high income)Sub-Saharan Africa (IDA & IBRD countries)SudanSwedenSwitzerlandSyrian Arab RepublicTajikistanTanzaniaThailandTogoTrinidad and TobagoTunisiaTurkeyTurkmenistanUkraineUnited Arab EmiratesUnited KingdomUnited StatesUpper middle incomeUruguayUzbekistanVenezuela, RBVietnamWorldYemen, Rep.ZambiaZimbabwe La ligne de temps
Cette échelle de temps montre un graphique de 1972 année à 2014 année Nicaragua. Les données jusqu'à 1971 année ne sont pas présentés. Quantité d'observations actuelles selon dates: 43.
Source (désignation):
Les indicateurs du développement mondiale
Source (organisation):
IEA Statistics © OECD/IEA 2014 (http://www.iea.org/stats/index.asp), subject to https://www.iea.org/t&c/termsandconditions/
Catégories:
Energy & Mining, Climate Change, Infrastructure
Dernière mise à jour
23 avr. 2017
Les indicateurs de changement de valeurs selon les années
Minimum:
35.471
1 janv. 1990
Maximum:
80.198
1 janv. 2002
Pour la date d''observation
Valeur
Changement absolu
Le changement par rapport à la valeur précédente
1 janv. 1972
65.196
+65.196
0.0%
1 janv. 1973
46.383
-18.813
-28.86%
1 janv. 1974
44.1
-2.283
-4.92%
1 janv. 1975
48.78
+4.68
10.61%
1 janv. 1976
52.041
+3.26
6.68%
1 janv. 1977
55.382
+3.341
6.42%
1 janv. 1978
75.346
+19.964
36.05%
1 janv. 1979
70.035
-5.311
-7.05%
1 janv. 1980
50.164
-19.871
-28.37%
1 janv. 1981
47.065
-3.1
-6.18%
1 janv. 1982
50.291
+3.227
6.86%
1 janv. 1983
55.788
+5.497
10.93%
1 janv. 1984
61.39
+5.601
10.04%
1 janv. 1985
43.362
-18.028
-29.37%
1 janv. 1986
43.217
-0.145
-0.33%
1 janv. 1987
52.137
+8.92
20.64%
1 janv. 1988
48.905
-3.233
-6.2%
1 janv. 1989
47.734
-1.17
-2.39%
1 janv. 1990
35.471
-12.263
-25.69%
1 janv. 1991
38.641
+3.17
8.94%
1 janv. 1992
39.748
+1.107
2.86%
1 janv. 1993
49.054
+9.306
23.41%
1 janv. 1994
42.997
-6.057
-12.35%
1 janv. 1995
51.546
+8.549
19.88%
1 janv. 1996
54.555
+3.009
5.84%
1 janv. 1997
56.498
+1.942
3.56%
1 janv. 1998
58.24
+1.742
3.08%
1 janv. 1999
72.154
+13.914
23.89%
1 janv. 2000
72.622
+0.469
0.65%
1 janv. 2001
78.605
+5.983
8.24%
1 janv. 2002
80.198
+1.594
2.03%
1 janv. 2003
75.42
-4.779
-5.96%
1 janv. 2004
72.944
-2.476
-3.28%
1 janv. 2005
72.279
-0.664
-0.91%
1 janv. 2006
65.388
-6.891
-9.53%
1 janv. 2007
69.943
+4.554
6.96%
1 janv. 2008
71.01
+1.067
1.53%
1 janv. 2009
64.475
-6.535
-9.2%
1 janv. 2010
69.099
+4.624
7.17%
1 janv. 2011
62.995
-6.104
-8.83%
1 janv. 2012
66.004
+3.009
4.78%
1 janv. 2013
57.182
-8.822
-13.37%
1 janv. 2014
47.658
-9.524
-16.66%
Classement des pays selon les statistiques actuelles par années


Commentaires: