29
/fr/
fr
AIzaSyAYiBZKx7MnpbEhh9jyipgxe19OcubqV5w
April 1, 2024
90845
Brazil
BRA
true
2
1
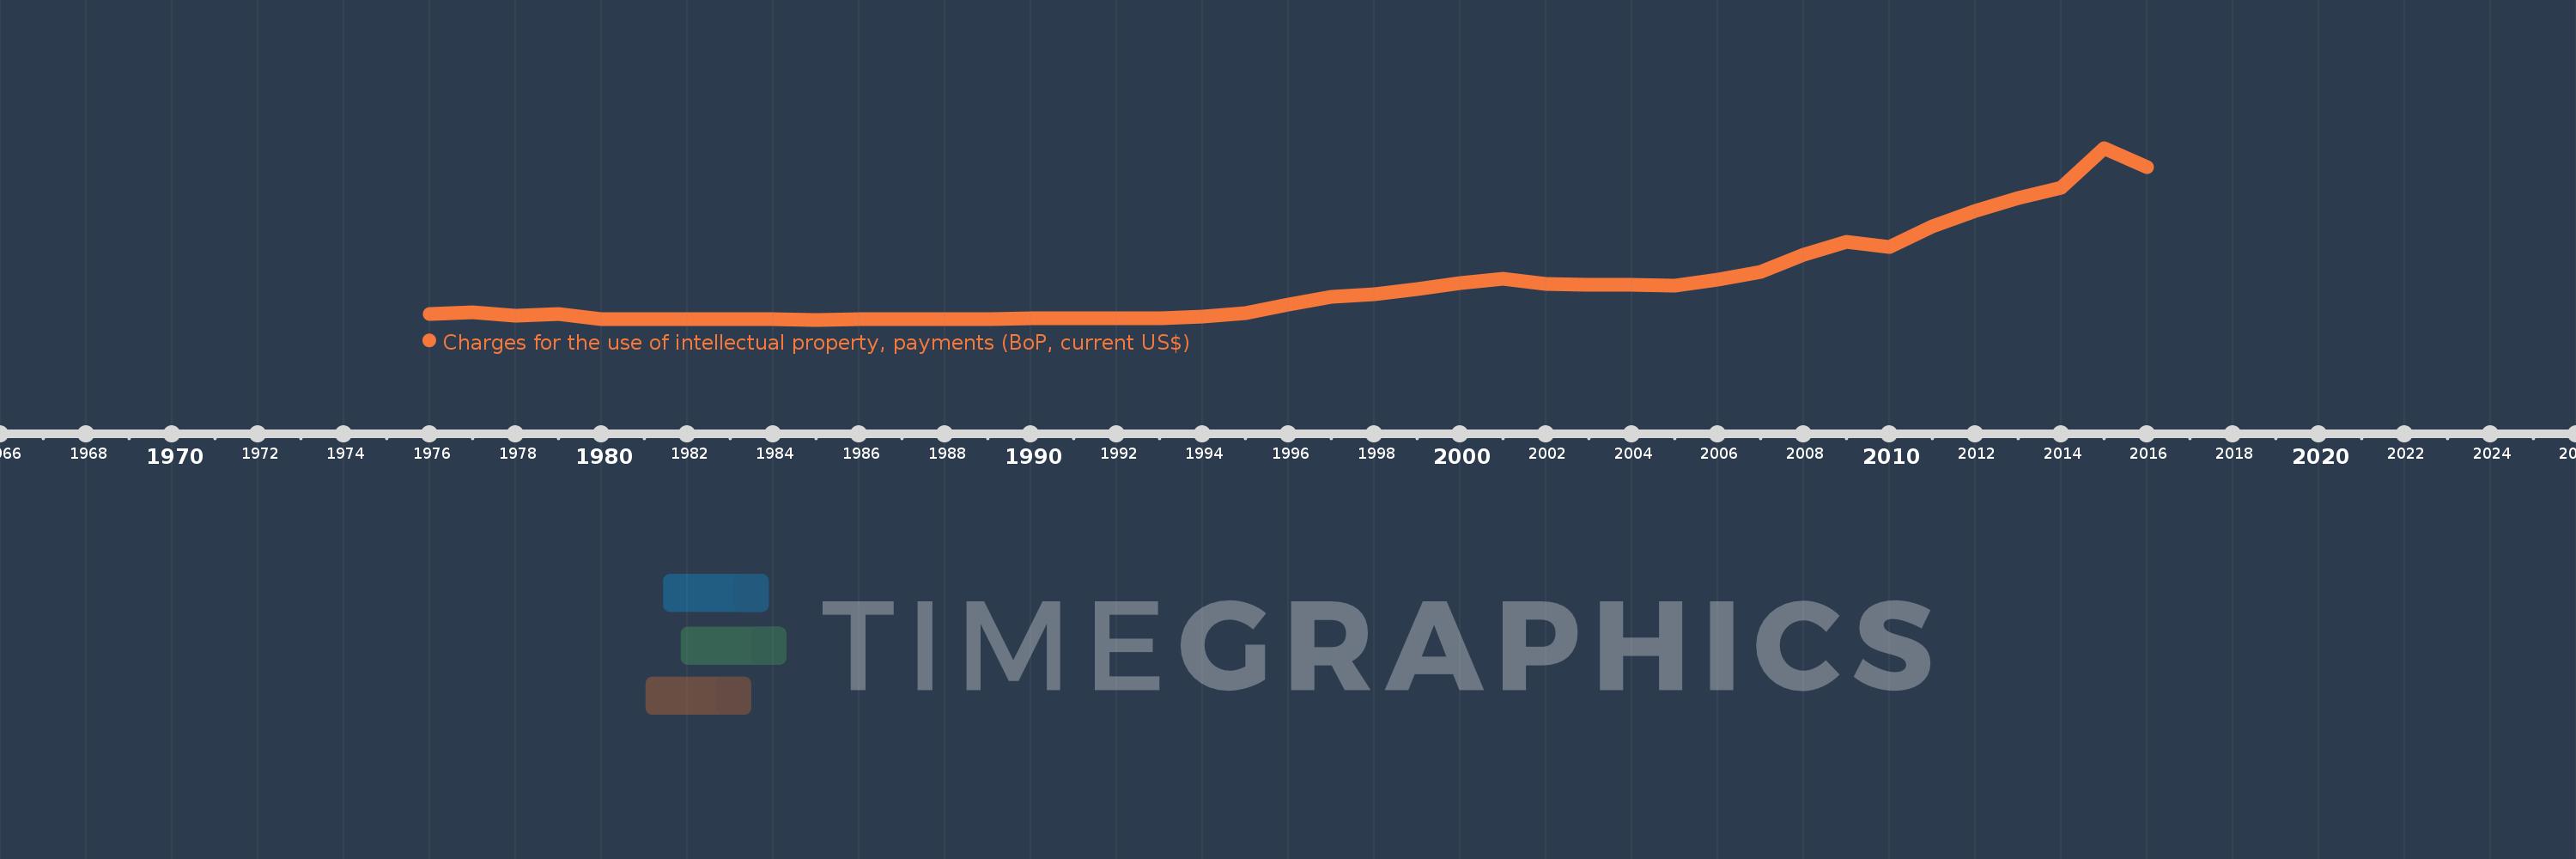
Charges for the use of intellectual property, payments (BoP, current US$)
2016,2015,2014,2013,2012,2011,2010,2009,2008,2007,2006,2005,2004,2003,2002,2001,2000,1999,1998,1997,1996,1995,1994,1993,1992,1991,1990,1989,1988,1987,1986,1985,1984,1983,1982,1981,1980,1979,1978,1977,1976
Cette statistique dans les autres pays:
La ligne de temps
Cette échelle de temps montre un graphique de 1976 année à 2016 année Brazil. Les données jusqu'à 1975 année ne sont pas présentés. Quantité d'observations actuelles selon dates: 41.
Source (désignation):
Les indicateurs du développement mondiale
Source (organisation):
International Monetary Fund, Balance of Payments Statistics Yearbook and data files.
Catégories:
Economy & Growth, Science & Technology
Dernière mise à jour
23 avr. 2017
Les indicateurs de changement de valeurs selon les années
Minimum:
17.0 mln.
1 janv. 1985
Maximum:
5.923 mds
1 janv. 2015
Pour la date d''observation
Valeur
Changement absolu
Le changement par rapport à la valeur précédente
1 janv. 1976
223.0 mln.
+223.0 mln.
0.0%
1 janv. 1977
263.0 mln.
+40.0 mln.
17.94%
1 janv. 1978
170.0 mln.
-93.0 mln.
-35.36%
1 janv. 1979
211.0 mln.
+41.0 mln.
24.12%
1 janv. 1980
36.0 mln.
-175.0 mln.
-82.94%
1 janv. 1981
38.0 mln.
+2.0 mln.
5.56%
1 janv. 1982
29.0 mln.
-9.0 mln.
-23.68%
1 janv. 1983
31.0 mln.
+2.0 mln.
6.9%
1 janv. 1984
26.0 mln.
-5.0 mln.
-16.13%
1 janv. 1985
17.0 mln.
-9.0 mln.
-34.62%
1 janv. 1986
30.0 mln.
+13.0 mln.
76.47%
1 janv. 1987
34.0 mln.
+4.0 mln.
13.33%
1 janv. 1988
41.0 mln.
+7.0 mln.
20.59%
1 janv. 1989
48.0 mln.
+7.0 mln.
17.07%
1 janv. 1990
70.0 mln.
+22.0 mln.
45.83%
1 janv. 1991
54.0 mln.
-16.0 mln.
-22.86%
1 janv. 1992
53.0 mln.
-1000.0 milles
-1.85%
1 janv. 1993
55.0 mln.
+2.0 mln.
3.77%
1 janv. 1994
121.0 mln.
+66.0 mln.
120.0%
1 janv. 1995
239.0 mln.
+118.0 mln.
97.52%
1 janv. 1996
529.0 mln.
+290.0 mln.
121.34%
1 janv. 1997
797.0 mln.
+268.0 mln.
50.66%
1 janv. 1998
887.0 mln.
+90.0 mln.
11.29%
1 janv. 1999
1.075 mds
+188.0 mln.
21.2%
1 janv. 2000
1.283 mds
+208.0 mln.
19.35%
1 janv. 2001
1.415 mds
+131.582 mln.
10.26%
1 janv. 2002
1.244 mds
-170.263 mln.
-12.04%
1 janv. 2003
1.229 mds
-15.53 mln.
-1.25%
1 janv. 2004
1.228 mds
-861.0 milles
-0.07%
1 janv. 2005
1.197 mds
-30.995 mln.
-2.52%
1 janv. 2006
1.404 mds
+207.561 mln.
17.34%
1 janv. 2007
1.664 mds
+259.183 mln.
18.45%
1 janv. 2008
2.259 mds
+595.756 mln.
35.81%
1 janv. 2009
2.697 mds
+437.738 mln.
19.37%
1 janv. 2010
2.512 mds
-185.127 mln.
-6.86%
1 janv. 2011
3.226 mds
+713.705 mln.
28.41%
1 janv. 2012
3.748 mds
+521.874 mln.
16.18%
1 janv. 2013
4.198 mds
+450.532 mln.
12.02%
1 janv. 2014
4.567 mds
+368.702 mln.
8.78%
1 janv. 2015
5.923 mds
+1.356 mds
29.69%
1 janv. 2016
5.25 mds
-672.196 mln.
-11.35%
Classement des pays selon les statistiques actuelles par années


Commentaires: