29
/fr/
fr
AIzaSyAYiBZKx7MnpbEhh9jyipgxe19OcubqV5w
April 1, 2024
125870
El Salvador
SLV
true
2
1
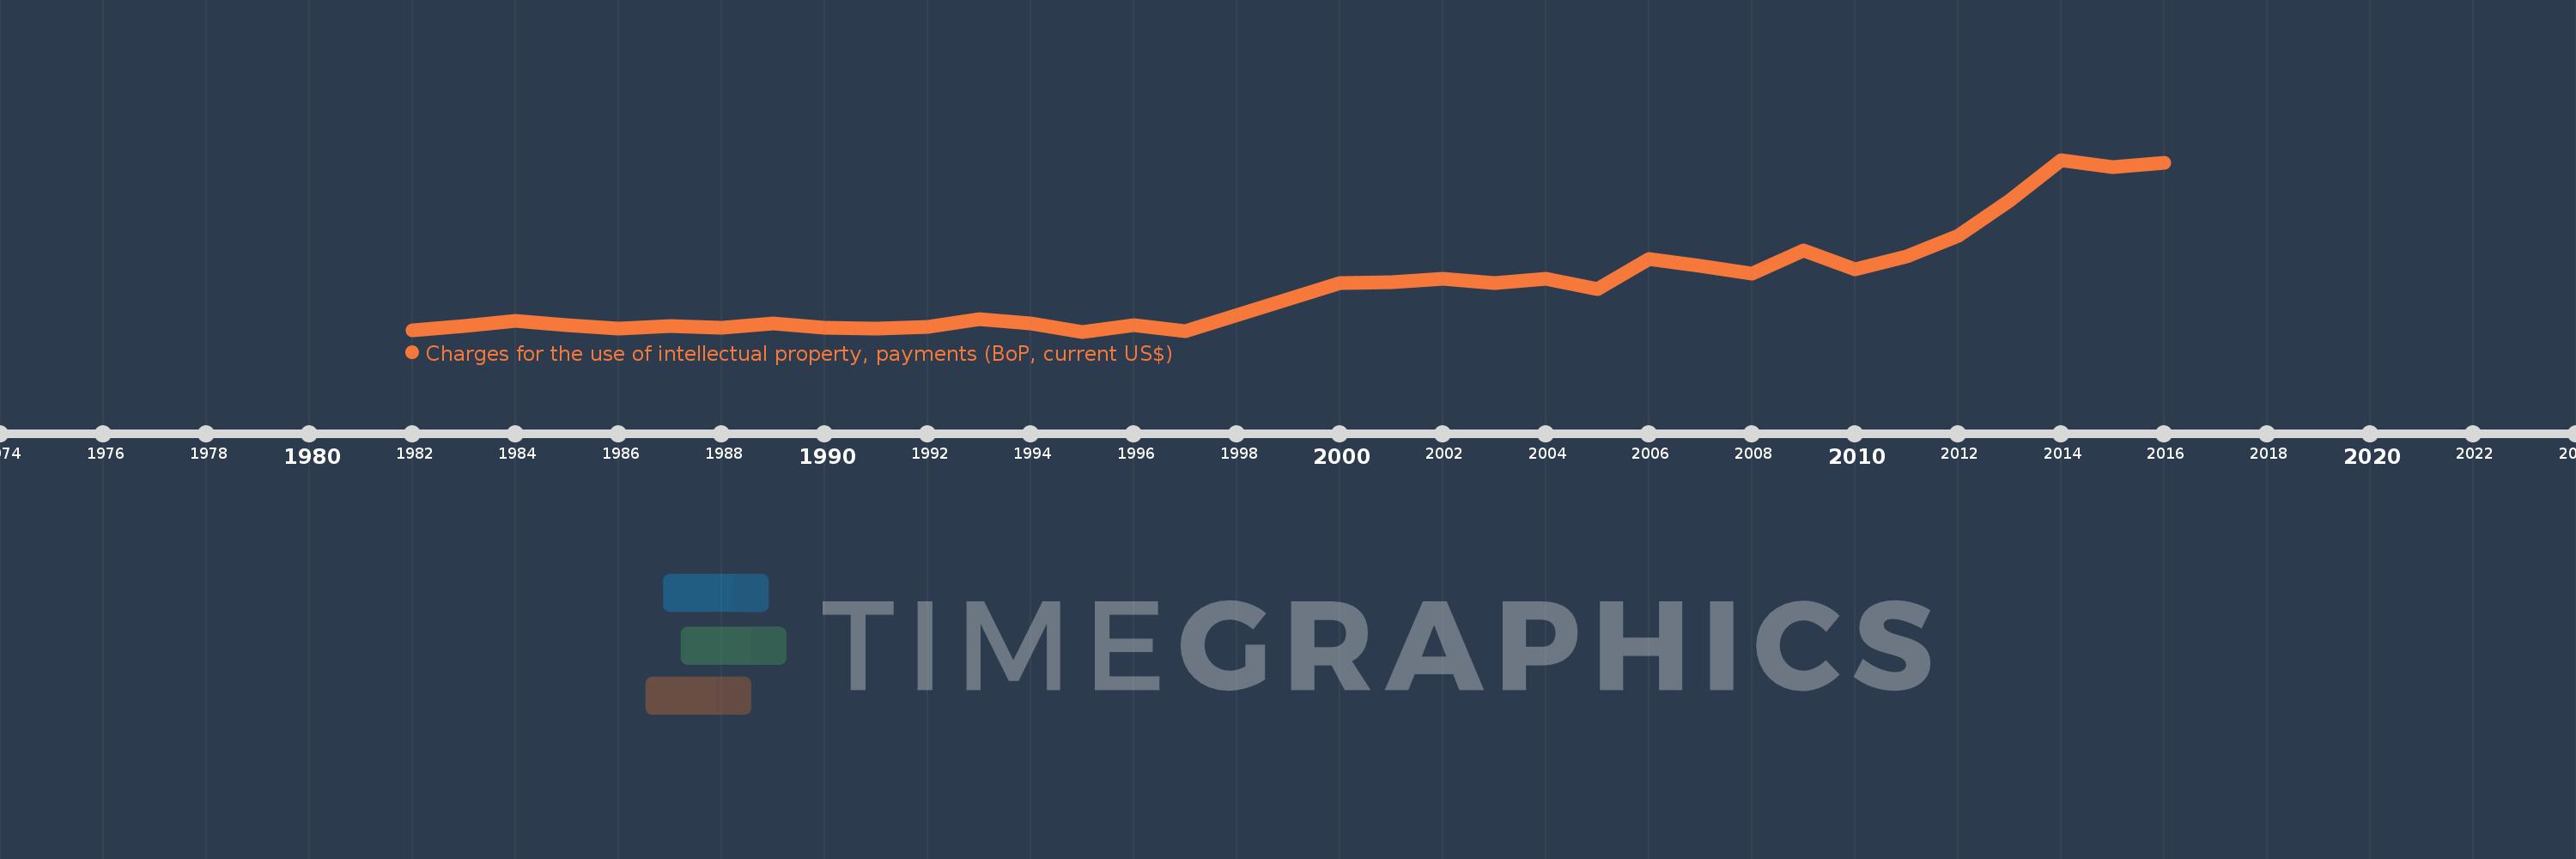
Charges for the use of intellectual property, payments (BoP, current US$)
2016,2015,2014,2013,2012,2011,2010,2009,2008,2007,2006,2005,2004,2003,2002,2001,2000,1997,1996,1995,1994,1993,1992,1991,1990,1989,1988,1987,1986,1985,1984,1983,1982
Cette statistique dans les autres pays:
La ligne de temps
Cette échelle de temps montre un graphique de 1982 année à 2016 année El Salvador. Les données jusqu'à 1981 année ne sont pas présentés. Quantité d'observations actuelles selon dates: 33.
Source (désignation):
Les indicateurs du développement mondiale
Source (organisation):
International Monetary Fund, Balance of Payments Statistics Yearbook and data files.
Catégories:
Economy & Growth, Science & Technology
Dernière mise à jour
23 avr. 2017
Les indicateurs de changement de valeurs selon les années
Minimum:
114.564 milles
1 janv. 1995
Maximum:
71.565 mln.
1 janv. 2014
Pour la date d''observation
Valeur
Changement absolu
Le changement par rapport à la valeur précédente
1 janv. 1982
720.0 milles
+720.0 milles
0.0%
1 janv. 1983
2.52 mln.
+1.8 mln.
250.0%
1 janv. 1984
4.44 mln.
+1.92 mln.
76.19%
1 janv. 1985
2.84 mln.
-1.6 mln.
-36.04%
1 janv. 1986
1.4 mln.
-1.44 mln.
-50.7%
1 janv. 1987
2.349 mln.
+949.474 milles
67.82%
1 janv. 1988
1.62 mln.
-729.474 milles
-31.05%
1 janv. 1989
3.4 mln.
+1.78 mln.
109.88%
1 janv. 1990
1.78 mln.
-1.62 mln.
-47.65%
1 janv. 1991
1.27 mln.
-509.618 milles
-28.63%
1 janv. 1992
2.245 mln.
+974.94 milles
76.74%
1 janv. 1993
5.143 mln.
+2.898 mln.
129.06%
1 janv. 1994
3.447 mln.
-1.696 mln.
-32.97%
1 janv. 1995
114.564 milles
-3.333 mln.
-96.68%
1 janv. 1996
2.856 mln.
+2.741 mln.
2.39 milles%
1 janv. 1997
228.441 milles
-2.627 mln.
-92.0%
1 janv. 2000
20.3 mln.
+20.072 mln.
8.79 milles%
1 janv. 2001
20.5 mln.
+200.0 milles
0.99%
1 janv. 2002
22.1 mln.
+1.6 mln.
7.8%
1 janv. 2003
20.4 mln.
-1.7 mln.
-7.69%
1 janv. 2004
22.2 mln.
+1.8 mln.
8.82%
1 janv. 2005
17.75 mln.
-4.45 mln.
-20.05%
1 janv. 2006
30.4 mln.
+12.65 mln.
71.27%
1 janv. 2007
27.3 mln.
-3.1 mln.
-10.2%
1 janv. 2008
24.1 mln.
-3.2 mln.
-11.72%
1 janv. 2009
33.7 mln.
+9.6 mln.
39.83%
1 janv. 2010
26.05 mln.
-7.65 mln.
-22.7%
1 janv. 2011
31.49 mln.
+5.44 mln.
20.88%
1 janv. 2012
39.934 mln.
+8.444 mln.
26.82%
1 janv. 2013
54.682 mln.
+14.747 mln.
36.93%
1 janv. 2014
71.565 mln.
+16.883 mln.
30.87%
1 janv. 2015
68.55 mln.
-3.014 mln.
-4.21%
1 janv. 2016
70.418 mln.
+1.868 mln.
2.72%
Classement des pays selon les statistiques actuelles par années


Commentaires: