29
/fr/
fr
AIzaSyAYiBZKx7MnpbEhh9jyipgxe19OcubqV5w
April 1, 2024
57905
South Asia (IDA & IBRD)
TSA
false
2
1
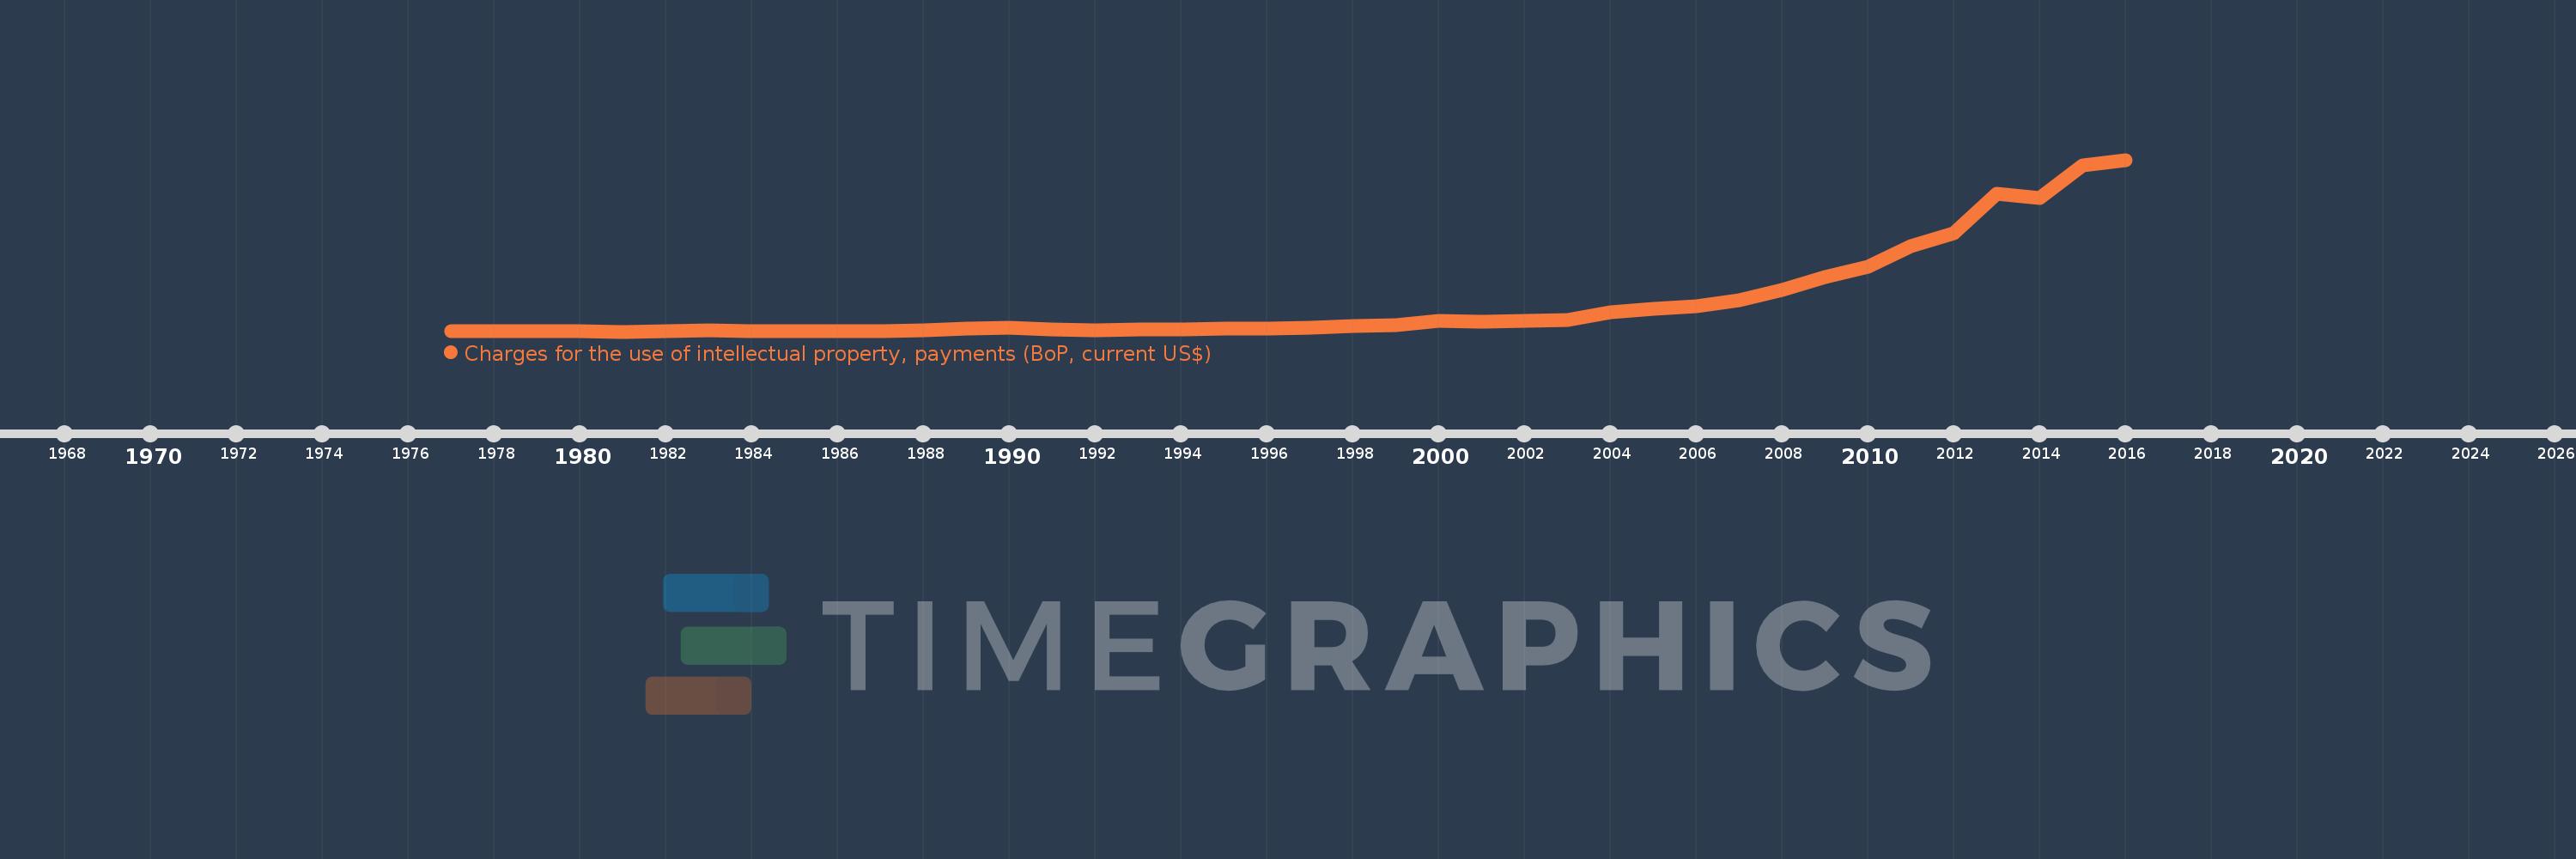
Charges for the use of intellectual property, payments (BoP, current US$)
2016,2015,2014,2013,2012,2011,2010,2009,2008,2007,2006,2005,2004,2003,2002,2001,2000,1999,1998,1997,1996,1995,1994,1993,1992,1991,1990,1989,1988,1987,1986,1985,1984,1983,1982,1981,1980,1979,1978,1977
Cette statistique dans les autres pays:
La ligne de temps
Cette échelle de temps montre un graphique de 1977 année à 2016 année South Asia (IDA & IBRD). Les données jusqu'à 1976 année ne sont pas présentés. Quantité d'observations actuelles selon dates: 40.
Source (désignation):
Les indicateurs du développement mondiale
Source (organisation):
International Monetary Fund, Balance of Payments Statistics Yearbook and data files.
Catégories:
Economy & Growth, Science & Technology
Dernière mise à jour
23 avr. 2017
Les indicateurs de changement de valeurs selon les années
Minimum:
12.456 mln.
1 janv. 1981
Maximum:
5.219 mds
1 janv. 2016
Pour la date d''observation
Valeur
Changement absolu
Le changement par rapport à la valeur précédente
1 janv. 1977
17.776 mln.
+17.776 mln.
0.0%
1 janv. 1978
23.026 mln.
+5.25 mln.
29.54%
1 janv. 1979
13.068 mln.
-9.958 mln.
-43.25%
1 janv. 1980
13.497 mln.
+428.087 milles
3.28%
1 janv. 1981
12.456 mln.
-1.041 mln.
-7.71%
1 janv. 1982
15.153 mln.
+2.698 mln.
21.66%
1 janv. 1983
38.854 mln.
+23.701 mln.
156.41%
1 janv. 1984
24.571 mln.
-14.283 mln.
-36.76%
1 janv. 1985
22.207 mln.
-2.364 mln.
-9.62%
1 janv. 1986
25.144 mln.
+2.937 mln.
13.22%
1 janv. 1987
24.935 mln.
-209.069 milles
-0.83%
1 janv. 1988
40.559 mln.
+15.624 mln.
62.66%
1 janv. 1989
108.394 mln.
+67.835 mln.
167.25%
1 janv. 1990
127.04 mln.
+18.646 mln.
17.2%
1 janv. 1991
72.466 mln.
-54.574 mln.
-42.96%
1 janv. 1992
49.565 mln.
-22.9 mln.
-31.6%
1 janv. 1993
68.598 mln.
+19.033 mln.
38.4%
1 janv. 1994
81.485 mln.
+12.886 mln.
18.79%
1 janv. 1995
105.695 mln.
+24.21 mln.
29.71%
1 janv. 1996
111.498 mln.
+5.803 mln.
5.49%
1 janv. 1997
136.404 mln.
+24.906 mln.
22.34%
1 janv. 1998
177.553 mln.
+41.149 mln.
30.17%
1 janv. 1999
216.909 mln.
+39.356 mln.
22.17%
1 janv. 2000
342.827 mln.
+125.918 mln.
58.05%
1 janv. 2001
314.884 mln.
-27.944 mln.
-8.15%
1 janv. 2002
341.537 mln.
+26.654 mln.
8.46%
1 janv. 2003
366.36 mln.
+24.823 mln.
7.27%
1 janv. 2004
589.602 mln.
+223.242 mln.
60.94%
1 janv. 2005
702.572 mln.
+112.97 mln.
19.16%
1 janv. 2006
785.2 mln.
+82.627 mln.
11.76%
1 janv. 2007
957.195 mln.
+171.996 mln.
21.9%
1 janv. 2008
1.276 mds
+318.387 mln.
33.26%
1 janv. 2009
1.67 mds
+394.513 mln.
30.93%
1 janv. 2010
1.97 mds
+299.93 mln.
17.96%
1 janv. 2011
2.608 mds
+638.407 mln.
32.41%
1 janv. 2012
3.001 mds
+392.603 mln.
15.05%
1 janv. 2013
4.181 mds
+1.18 mds
39.33%
1 janv. 2014
4.06 mds
-121.605 mln.
-2.91%
1 janv. 2015
5.043 mds
+983.399 mln.
24.22%
1 janv. 2016
5.219 mds
+176.262 mln.
3.5%
Classement des pays selon les statistiques actuelles par années


Commentaires: