29
/fr/
fr
AIzaSyAYiBZKx7MnpbEhh9jyipgxe19OcubqV5w
April 1, 2024
47958
Middle East & North Africa
MEA
false
2
1
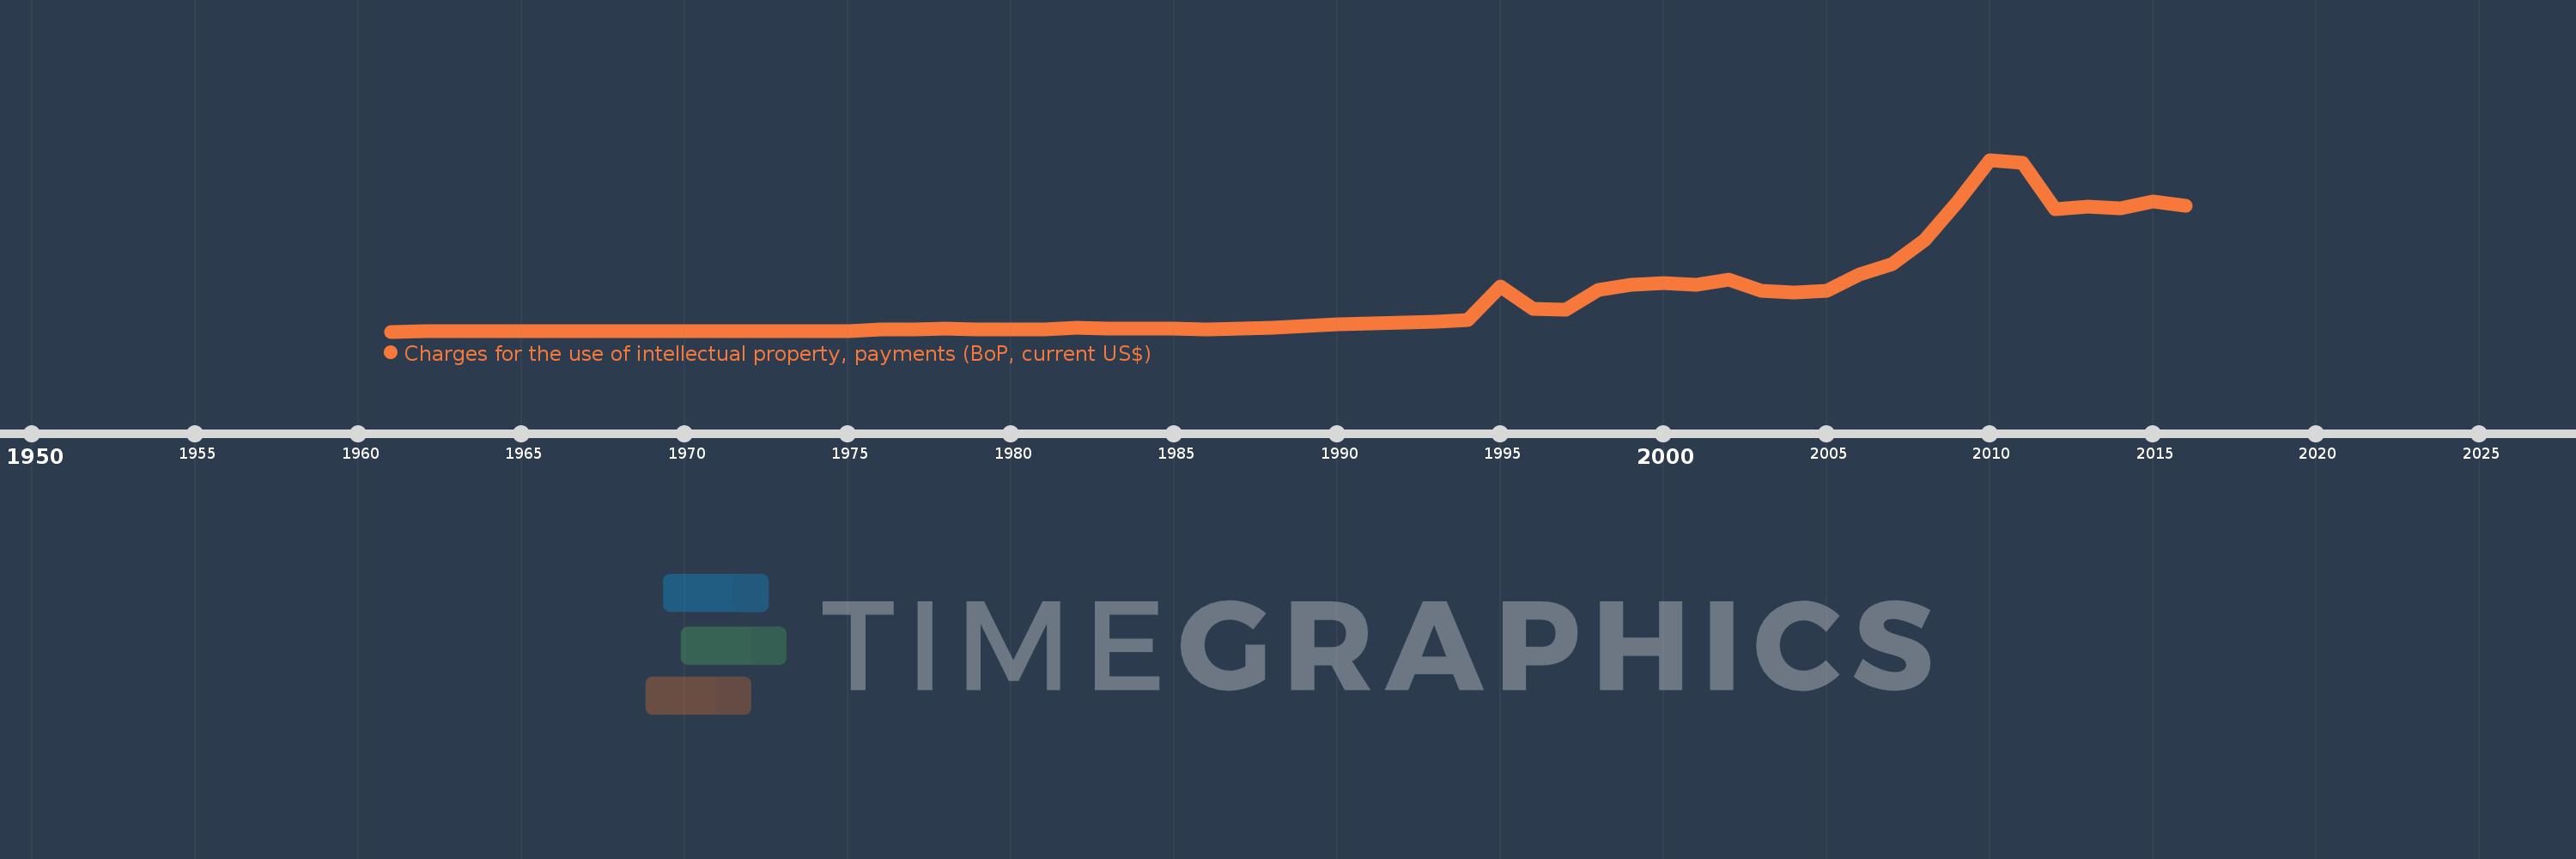
Charges for the use of intellectual property, payments (BoP, current US$)
2016,2015,2014,2013,2012,2011,2010,2009,2008,2007,2006,2005,2004,2003,2002,2001,2000,1999,1998,1997,1996,1995,1994,1993,1992,1991,1990,1989,1988,1987,1986,1985,1984,1983,1982,1981,1980,1979,1978,1977,1976,1975,1974,1973,1972,1971,1970,1969,1968,1967,1966,1962,1961
Cette statistique dans les autres pays:
La ligne de temps
Cette échelle de temps montre un graphique de 1961 année à 2016 année Middle East & North Africa. Les données jusqu'à 1960 année ne sont pas présentés. Quantité d'observations actuelles selon dates: 53.
Source (désignation):
Les indicateurs du développement mondiale
Source (organisation):
International Monetary Fund, Balance of Payments Statistics Yearbook and data files.
Catégories:
Economy & Growth, Science & Technology
Dernière mise à jour
23 avr. 2017
Les indicateurs de changement de valeurs selon les années
Minimum:
1000.0 milles
1 janv. 1961
Maximum:
2.903 mds
1 janv. 2010
Pour la date d''observation
Valeur
Changement absolu
Le changement par rapport à la valeur précédente
1 janv. 1961
1000.0 milles
+1000.0 milles
0.0%
1 janv. 1962
2.0 mln.
+1000.0 milles
100.0%
1 janv. 1966
2.0 mln.
0.0
0.0%
1 janv. 1967
2.0 mln.
0.0
0.0%
1 janv. 1968
2.0 mln.
0.0
0.0%
1 janv. 1969
3.0 mln.
+1000.0 milles
50.0%
1 janv. 1970
3.0 mln.
0.0
0.0%
1 janv. 1971
3.0 mln.
0.0
0.0%
1 janv. 1972
4.0 mln.
+1000.0 milles
33.33%
1 janv. 1973
6.0 mln.
+2.0 mln.
50.0%
1 janv. 1974
4.271 mln.
-1.729 mln.
-28.81%
1 janv. 1975
8.259 mln.
+3.988 mln.
93.38%
1 janv. 1976
32.222 mln.
+23.962 mln.
290.12%
1 janv. 1977
38.208 mln.
+5.986 mln.
18.58%
1 janv. 1978
48.47 mln.
+10.262 mln.
26.86%
1 janv. 1979
41.337 mln.
-7.134 mln.
-14.72%
1 janv. 1980
41.318 mln.
-18.991 milles
-0.05%
1 janv. 1981
42.699 mln.
+1.382 mln.
3.34%
1 janv. 1982
60.33 mln.
+17.631 mln.
41.29%
1 janv. 1983
57.145 mln.
-3.185 mln.
-5.28%
1 janv. 1984
49.35 mln.
-7.796 mln.
-13.64%
1 janv. 1985
48.596 mln.
-753.423 milles
-1.53%
1 janv. 1986
39.213 mln.
-9.384 mln.
-19.31%
1 janv. 1987
49.25 mln.
+10.037 mln.
25.6%
1 janv. 1988
70.034 mln.
+20.784 mln.
42.2%
1 janv. 1989
102.024 mln.
+31.99 mln.
45.68%
1 janv. 1990
118.026 mln.
+16.002 mln.
15.68%
1 janv. 1991
137.685 mln.
+19.659 mln.
16.66%
1 janv. 1992
150.041 mln.
+12.356 mln.
8.97%
1 janv. 1993
174.353 mln.
+24.312 mln.
16.2%
1 janv. 1994
192.735 mln.
+18.383 mln.
10.54%
1 janv. 1995
763.322 mln.
+570.587 mln.
296.05%
1 janv. 1996
388.242 mln.
-375.08 mln.
-49.14%
1 janv. 1997
370.286 mln.
-17.956 mln.
-4.62%
1 janv. 1998
699.84 mln.
+329.554 mln.
89.0%
1 janv. 1999
791.239 mln.
+91.399 mln.
13.06%
1 janv. 2000
815.578 mln.
+24.339 mln.
3.08%
1 janv. 2001
793.501 mln.
-22.077 mln.
-2.71%
1 janv. 2002
872.381 mln.
+78.88 mln.
9.94%
1 janv. 2003
695.09 mln.
-177.291 mln.
-20.32%
1 janv. 2004
659.11 mln.
-35.98 mln.
-5.18%
1 janv. 2005
684.65 mln.
+25.54 mln.
3.87%
1 janv. 2006
959.876 mln.
+275.226 mln.
40.2%
1 janv. 2007
1.141 mds
+180.863 mln.
18.84%
1 janv. 2008
1.551 mds
+410.306 mln.
35.97%
1 janv. 2009
2.184 mds
+633.148 mln.
40.82%
1 janv. 2010
2.903 mds
+718.46 mln.
32.89%
1 janv. 2011
2.849 mds
-54.017 mln.
-1.86%
1 janv. 2012
2.071 mds
-777.503 mln.
-27.29%
1 janv. 2013
2.109 mds
+37.761 mln.
1.82%
1 janv. 2014
2.088 mds
-21.394 mln.
-1.01%
1 janv. 2015
2.202 mds
+114.525 mln.
5.49%
1 janv. 2016
2.122 mds
-79.636 mln.
-3.62%
Classement des pays selon les statistiques actuelles par années


Commentaires: