29
/fr/
fr
AIzaSyAYiBZKx7MnpbEhh9jyipgxe19OcubqV5w
April 1, 2024
111942
Costa Rica
CRI
true
2
1
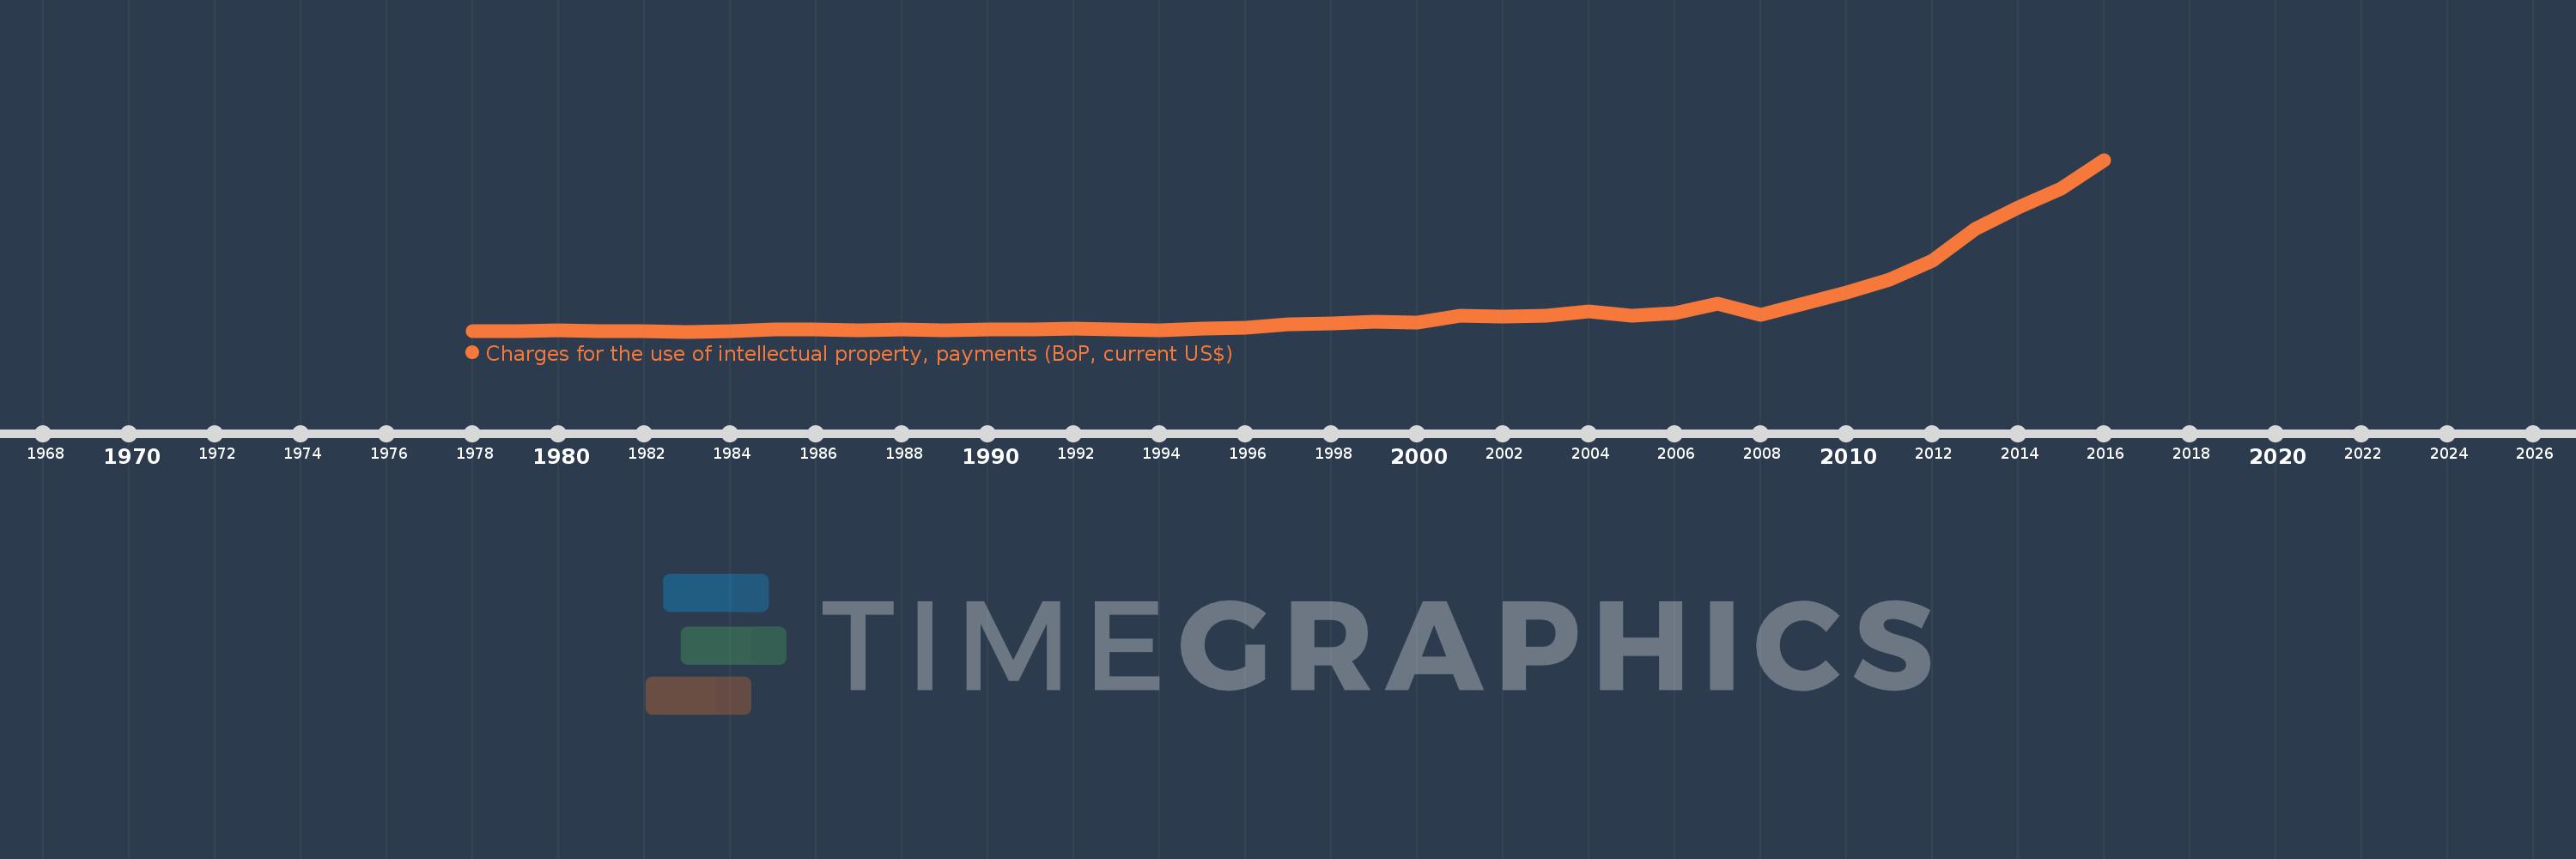
Charges for the use of intellectual property, payments (BoP, current US$)
2016,2015,2014,2013,2012,2011,2010,2009,2008,2007,2006,2005,2004,2003,2002,2001,2000,1999,1998,1997,1996,1995,1994,1993,1992,1991,1990,1989,1988,1987,1986,1985,1984,1983,1982,1981,1980,1979,1978
Cette statistique dans les autres pays:
La ligne de temps
Cette échelle de temps montre un graphique de 1978 année à 2016 année Costa Rica. Les données jusqu'à 1977 année ne sont pas présentés. Quantité d'observations actuelles selon dates: 39.
Source (désignation):
Les indicateurs du développement mondiale
Source (organisation):
International Monetary Fund, Balance of Payments Statistics Yearbook and data files.
Catégories:
Economy & Growth, Science & Technology
Dernière mise à jour
23 avr. 2017
Les indicateurs de changement de valeurs selon les années
Minimum:
2.9 mln.
1 janv. 1983
Maximum:
516.675 mln.
1 janv. 2016
Pour la date d''observation
Valeur
Changement absolu
Le changement par rapport à la valeur précédente
1 janv. 1978
4.2 mln.
+4.2 mln.
0.0%
1 janv. 1979
4.5 mln.
+300.0 milles
7.14%
1 janv. 1980
5.7 mln.
+1.2 mln.
26.67%
1 janv. 1981
4.3 mln.
-1.4 mln.
-24.56%
1 janv. 1982
4.1 mln.
-200.0 milles
-4.65%
1 janv. 1983
2.9 mln.
-1.2 mln.
-29.27%
1 janv. 1984
3.6 mln.
+700.0 milles
24.14%
1 janv. 1985
9.1 mln.
+5.5 mln.
152.78%
1 janv. 1986
9.6 mln.
+500.0 milles
5.49%
1 janv. 1987
7.9 mln.
-1.7 mln.
-17.71%
1 janv. 1988
8.6 mln.
+700.0 milles
8.86%
1 janv. 1989
7.6 mln.
-1000.0 milles
-11.63%
1 janv. 1990
10.0 mln.
+2.4 mln.
31.58%
1 janv. 1991
9.1 mln.
-900.0 milles
-9.0%
1 janv. 1992
11.0 mln.
+1.9 mln.
20.88%
1 janv. 1993
9.2 mln.
-1.8 mln.
-16.36%
1 janv. 1994
5.5 mln.
-3.7 mln.
-40.22%
1 janv. 1995
11.0 mln.
+5.5 mln.
100.0%
1 janv. 1996
13.4 mln.
+2.4 mln.
21.82%
1 janv. 1997
23.57 mln.
+10.17 mln.
75.9%
1 janv. 1998
27.19 mln.
+3.62 mln.
15.36%
1 janv. 1999
31.97 mln.
+4.78 mln.
17.58%
1 janv. 2000
30.796 mln.
-1.174 mln.
-3.67%
1 janv. 2001
49.834 mln.
+19.038 mln.
61.82%
1 janv. 2002
49.022 mln.
-811.917 milles
-1.63%
1 janv. 2003
51.154 mln.
+2.132 mln.
4.35%
1 janv. 2004
63.871 mln.
+12.717 mln.
24.86%
1 janv. 2005
51.359 mln.
-12.512 mln.
-19.59%
1 janv. 2006
56.876 mln.
+5.517 mln.
10.74%
1 janv. 2007
87.482 mln.
+30.606 mln.
53.81%
1 janv. 2008
52.945 mln.
-34.537 mln.
-39.48%
1 janv. 2009
86.391 mln.
+33.446 mln.
63.17%
1 janv. 2010
119.401 mln.
+33.01 mln.
38.21%
1 janv. 2011
158.856 mln.
+39.455 mln.
33.04%
1 janv. 2012
214.778 mln.
+55.922 mln.
35.2%
1 janv. 2013
310.561 mln.
+95.783 mln.
44.6%
1 janv. 2014
374.402 mln.
+63.841 mln.
20.56%
1 janv. 2015
430.563 mln.
+56.16 mln.
15.0%
1 janv. 2016
516.675 mln.
+86.113 mln.
20.0%
Classement des pays selon les statistiques actuelles par années


Commentaires: