30
/fr/
AIzaSyAYiBZKx7MnpbEhh9jyipgxe19OcubqV5w
April 1, 2024
89917
Botswana
BWA
true
2
1
ICT service exports (BoP, current US$)
2016,2015,2014,2013,2012,2011,2010,2009,2008,2007,2006,2005,2004,2003,2002,2001,2000,1999,1998,1996,1995,1994,1993,1992,1991
Download
Bibliothèque de statistiques globales →Botswana →

ICT service exports (BoP, current US$)

Cette statistique dans les autres pays:

AfghanistanAlbaniaAlgeriaAngolaAntigua and BarbudaArab WorldArgentinaArmeniaArubaAustraliaAustriaAzerbaijanBahrainBangladeshBarbadosBelarusBelgiumBelizeBeninBermudaBhutanBoliviaBosnia and HerzegovinaBotswanaBrazilBrunei DarussalamBulgariaBurkina FasoBurundiCabo VerdeCambodiaCameroonCanadaCaribbean small statesCentral Europe and the BalticsChileChinaColombiaComorosCongo, Dem. Rep.Congo, Rep.Costa RicaCote d'IvoireCroatiaCuracaoCyprusCzech RepublicDenmarkDjiboutiDominicaDominican RepublicEarly-demographic dividendEast Asia & PacificEast Asia & Pacific (excluding high income)East Asia & Pacific (IDA & IBRD countries)EcuadorEgypt, Arab Rep.El SalvadorEritreaEstoniaEthiopiaEuro areaEurope & Central AsiaEurope & Central Asia (excluding high income)Europe & Central Asia (IDA & IBRD countries)European UnionFaroe IslandsFijiFinlandFragile and conflict affected situationsFranceFrench PolynesiaGabonGambia, TheGeorgiaGermanyGreeceGrenadaGuatemalaGuineaGuinea-BissauGuyanaHeavily indebted poor countries (HIPC)High incomeHondurasHong Kong SAR, ChinaHungaryIBRD onlyIcelandIDA & IBRD totalIDA blendIDA onlyIDA totalIndiaIndonesiaIraqIrelandIsraelItalyJamaicaJapanJordanKazakhstanKenyaKorea, Rep.KosovoKuwaitKyrgyz RepublicLao PDRLate-demographic dividendLatin America & Caribbean Latin America & Caribbean (excluding high income)Latin America & the Caribbean (IDA & IBRD countries)LatviaLeast developed countries: UN classificationLebanonLesothoLithuaniaLow & middle incomeLow incomeLower middle incomeLuxembourgMacao SAR, ChinaMacedonia, FYRMadagascarMalawiMalaysiaMaliMaltaMauritaniaMauritiusMexicoMicronesia, Fed. Sts.Middle East & North AfricaMiddle East & North Africa (excluding high income)Middle East & North Africa (IDA & IBRD countries)Middle incomeMoldovaMongoliaMontenegroMoroccoMozambiqueMyanmarNamibiaNepalNetherlandsNew CaledoniaNew ZealandNicaraguaNigerNigeriaNorth AmericaNorwayOECD membersOmanPacific island small statesPakistanPalauPanamaPapua New GuineaParaguayPeruPhilippinesPolandPortugalPost-demographic dividendPre-demographic dividendRomaniaRussian FederationRwandaSamoaSao Tome and PrincipeSaudi ArabiaSenegalSerbiaSeychellesSierra LeoneSingaporeSint Maarten (Dutch part)Slovak RepublicSloveniaSmall statesSolomon IslandsSouth AfricaSouth AsiaSouth Asia (IDA & IBRD)South SudanSpainSri LankaSt. Kitts and NevisSt. LuciaSt. Vincent and the GrenadinesSub-Saharan Africa Sub-Saharan Africa (excluding high income)Sub-Saharan Africa (IDA & IBRD countries)SudanSurinameSwazilandSwedenSwitzerlandSyrian Arab RepublicTajikistanTanzaniaThailandTogoTongaTrinidad and TobagoTunisiaTurkeyTuvaluUgandaUkraineUnited KingdomUnited StatesUpper middle incomeUruguayVanuatuVenezuela, RBWest Bank and GazaWorldYemen, Rep.ZambiaZimbabwe

La ligne de temps

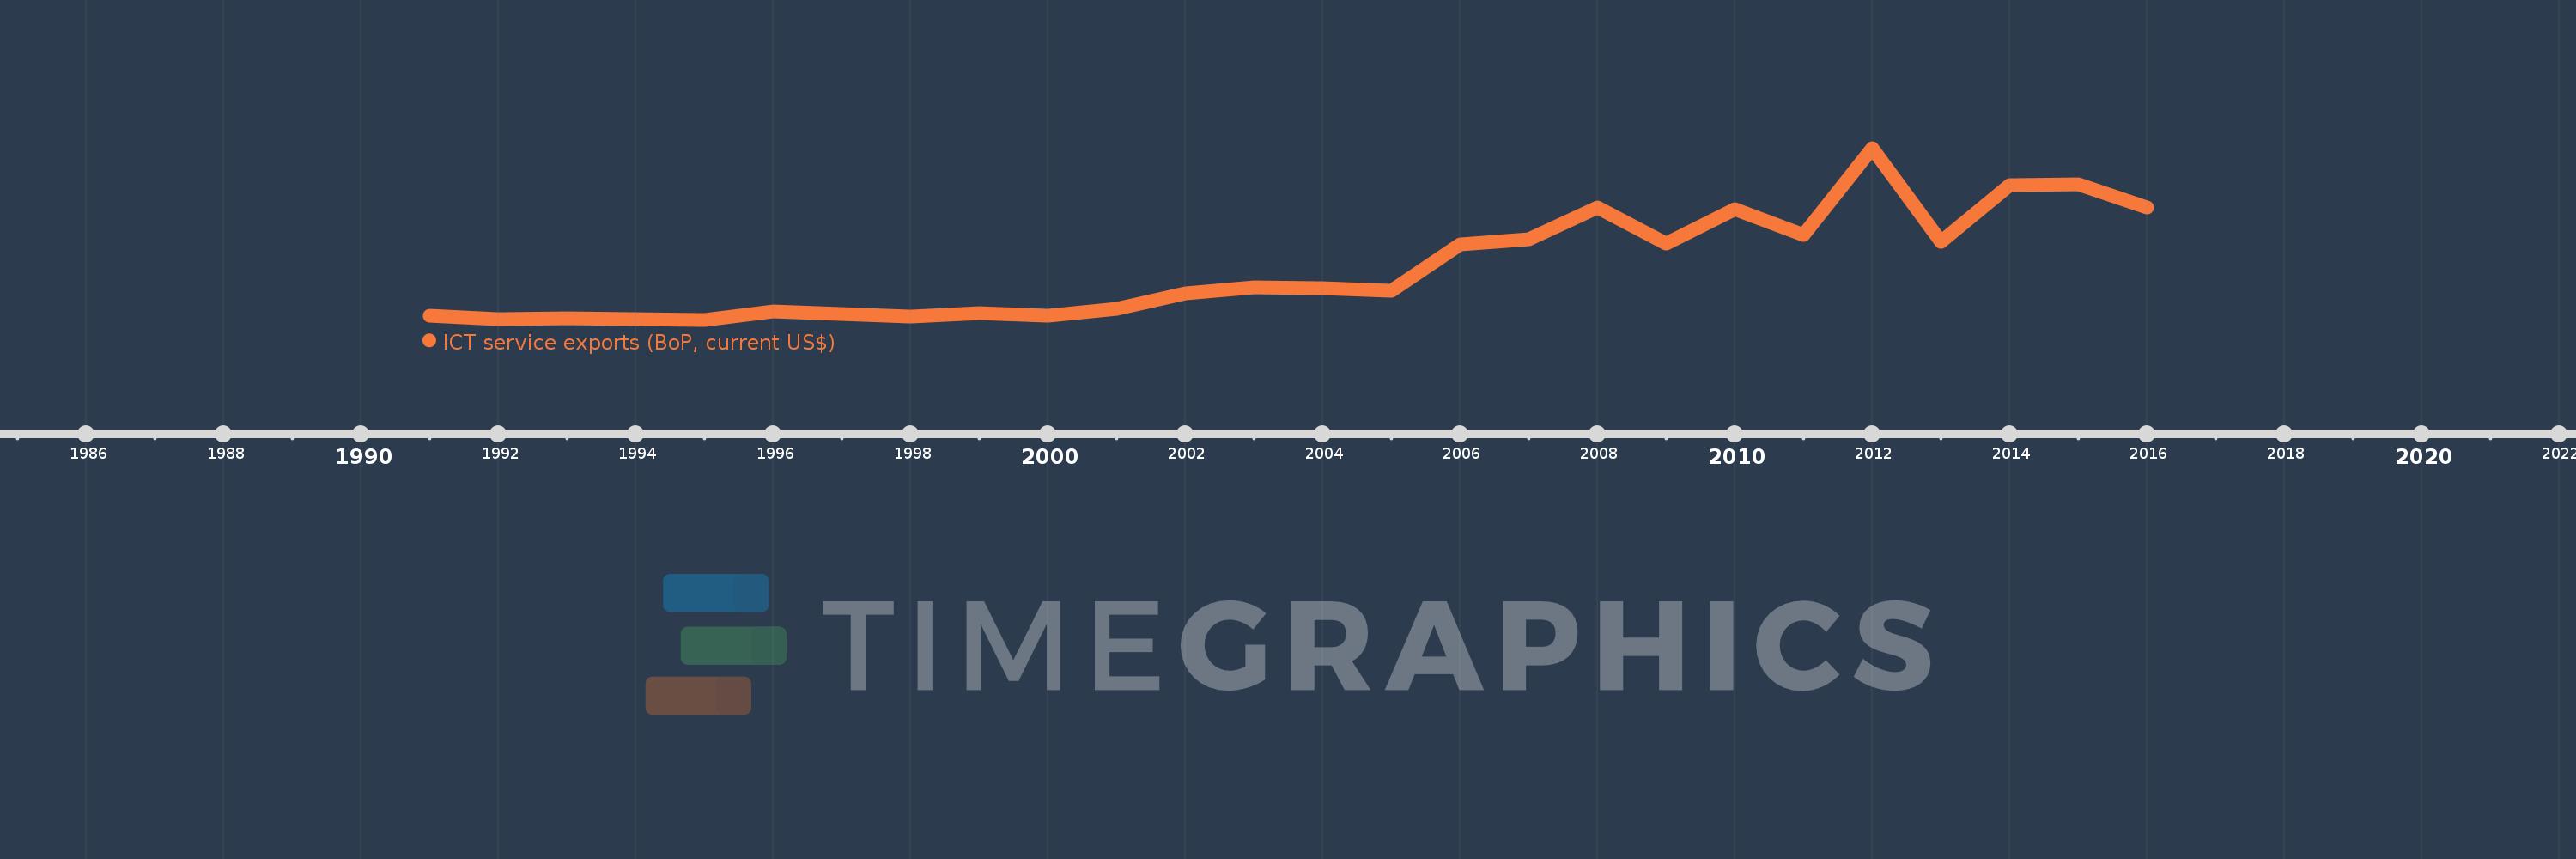
Cette échelle de temps montre un graphique de 1991 année à 2016 année Botswana. Les données jusqu'à 1990 année ne sont pas présentés. Quantité d'observations actuelles selon dates: 25.

Source (désignation):

Les indicateurs du développement mondiale

Source (organisation):

International Monetary Fund, Balance of Payments Statistics Yearbook and data files.

Catégories:

Economy & Growth, Infrastructure, Trade

Dernière mise à jour

23 avr. 2017

Les indicateurs de changement de valeurs selon les années

En moyenne:
76.526 mln.
Minimum:
5.96 mln.
1 janv. 1995
Maximum:
233.955 mln.
1 janv. 2012
Pour la date d''observation
Valeur
Changement absolu
Le changement par rapport à la valeur précédente
1 janv. 1991
11.126 mln.
+11.126 mln.
0.0%
1 janv. 1992
6.53 mln.
-4.597 mln.
-41.31%
1 janv. 1993
7.394 mln.
+864.707 milles
13.24%
1 janv. 1994
6.644 mln.
-749.879 milles
-10.14%
1 janv. 1995
5.96 mln.
-684.631 milles
-10.3%
1 janv. 1996
16.882 mln.
+10.922 mln.
183.26%
1 janv. 1998
10.247 mln.
-6.635 mln.
-39.3%
1 janv. 1999
14.26 mln.
+4.013 mln.
39.16%
1 janv. 2000
11.245 mln.
-3.015 mln.
-21.15%
1 janv. 2001
20.125 mln.
+8.88 mln.
78.97%
1 janv. 2002
41.426 mln.
+21.302 mln.
105.85%
1 janv. 2003
48.391 mln.
+6.965 mln.
16.81%
1 janv. 2004
47.237 mln.
-1.154 mln.
-2.39%
1 janv. 2005
44.441 mln.
-2.796 mln.
-5.92%
1 janv. 2006
105.712 mln.
+61.271 mln.
137.87%
1 janv. 2007
112.436 mln.
+6.724 mln.
6.36%
1 janv. 2008
155.171 mln.
+42.735 mln.
38.01%
1 janv. 2009
107.534 mln.
-47.637 mln.
-30.7%
1 janv. 2010
152.481 mln.
+44.947 mln.
41.8%
1 janv. 2011
118.798 mln.
-33.683 mln.
-22.09%
1 janv. 2012
233.955 mln.
+115.157 mln.
96.93%
1 janv. 2013
109.596 mln.
-124.359 mln.
-53.16%
1 janv. 2014
184.985 mln.
+75.389 mln.
68.79%
1 janv. 2015
186.094 mln.
+1.11 mln.
0.6%
1 janv. 2016
154.479 mln.
-31.616 mln.
-16.99%

Classement des pays selon les statistiques actuelles par années