30
/fr/
AIzaSyAYiBZKx7MnpbEhh9jyipgxe19OcubqV5w
April 1, 2024
222298
Peru
PER
true
2
1
ICT service exports (BoP, current US$)
2016,2015,2014,2013,2012,2011,2010,2009,2008,2007,2006,2005,2004,2003,2002,2001,2000,1999,1998,1997,1996,1995,1994,1993,1992,1991
Download
Bibliothèque de statistiques globales →Peru →

ICT service exports (BoP, current US$)

Cette statistique dans les autres pays:

AfghanistanAlbaniaAlgeriaAngolaAntigua and BarbudaArab WorldArgentinaArmeniaArubaAustraliaAustriaAzerbaijanBahrainBangladeshBarbadosBelarusBelgiumBelizeBeninBermudaBhutanBoliviaBosnia and HerzegovinaBotswanaBrazilBrunei DarussalamBulgariaBurkina FasoBurundiCabo VerdeCambodiaCameroonCanadaCaribbean small statesCentral Europe and the BalticsChileChinaColombiaComorosCongo, Dem. Rep.Congo, Rep.Costa RicaCote d'IvoireCroatiaCuracaoCyprusCzech RepublicDenmarkDjiboutiDominicaDominican RepublicEarly-demographic dividendEast Asia & PacificEast Asia & Pacific (excluding high income)East Asia & Pacific (IDA & IBRD countries)EcuadorEgypt, Arab Rep.El SalvadorEritreaEstoniaEthiopiaEuro areaEurope & Central AsiaEurope & Central Asia (excluding high income)Europe & Central Asia (IDA & IBRD countries)European UnionFaroe IslandsFijiFinlandFragile and conflict affected situationsFranceFrench PolynesiaGabonGambia, TheGeorgiaGermanyGreeceGrenadaGuatemalaGuineaGuinea-BissauGuyanaHeavily indebted poor countries (HIPC)High incomeHondurasHong Kong SAR, ChinaHungaryIBRD onlyIcelandIDA & IBRD totalIDA blendIDA onlyIDA totalIndiaIndonesiaIraqIrelandIsraelItalyJamaicaJapanJordanKazakhstanKenyaKorea, Rep.KosovoKuwaitKyrgyz RepublicLao PDRLate-demographic dividendLatin America & Caribbean Latin America & Caribbean (excluding high income)Latin America & the Caribbean (IDA & IBRD countries)LatviaLeast developed countries: UN classificationLebanonLesothoLithuaniaLow & middle incomeLow incomeLower middle incomeLuxembourgMacao SAR, ChinaMacedonia, FYRMadagascarMalawiMalaysiaMaliMaltaMauritaniaMauritiusMexicoMicronesia, Fed. Sts.Middle East & North AfricaMiddle East & North Africa (excluding high income)Middle East & North Africa (IDA & IBRD countries)Middle incomeMoldovaMongoliaMontenegroMoroccoMozambiqueMyanmarNamibiaNepalNetherlandsNew CaledoniaNew ZealandNicaraguaNigerNigeriaNorth AmericaNorwayOECD membersOmanPacific island small statesPakistanPalauPanamaPapua New GuineaParaguayPeruPhilippinesPolandPortugalPost-demographic dividendPre-demographic dividendRomaniaRussian FederationRwandaSamoaSao Tome and PrincipeSaudi ArabiaSenegalSerbiaSeychellesSierra LeoneSingaporeSint Maarten (Dutch part)Slovak RepublicSloveniaSmall statesSolomon IslandsSouth AfricaSouth AsiaSouth Asia (IDA & IBRD)South SudanSpainSri LankaSt. Kitts and NevisSt. LuciaSt. Vincent and the GrenadinesSub-Saharan Africa Sub-Saharan Africa (excluding high income)Sub-Saharan Africa (IDA & IBRD countries)SudanSurinameSwazilandSwedenSwitzerlandSyrian Arab RepublicTajikistanTanzaniaThailandTogoTongaTrinidad and TobagoTunisiaTurkeyTuvaluUgandaUkraineUnited KingdomUnited StatesUpper middle incomeUruguayVanuatuVenezuela, RBWest Bank and GazaWorldYemen, Rep.ZambiaZimbabwe

La ligne de temps

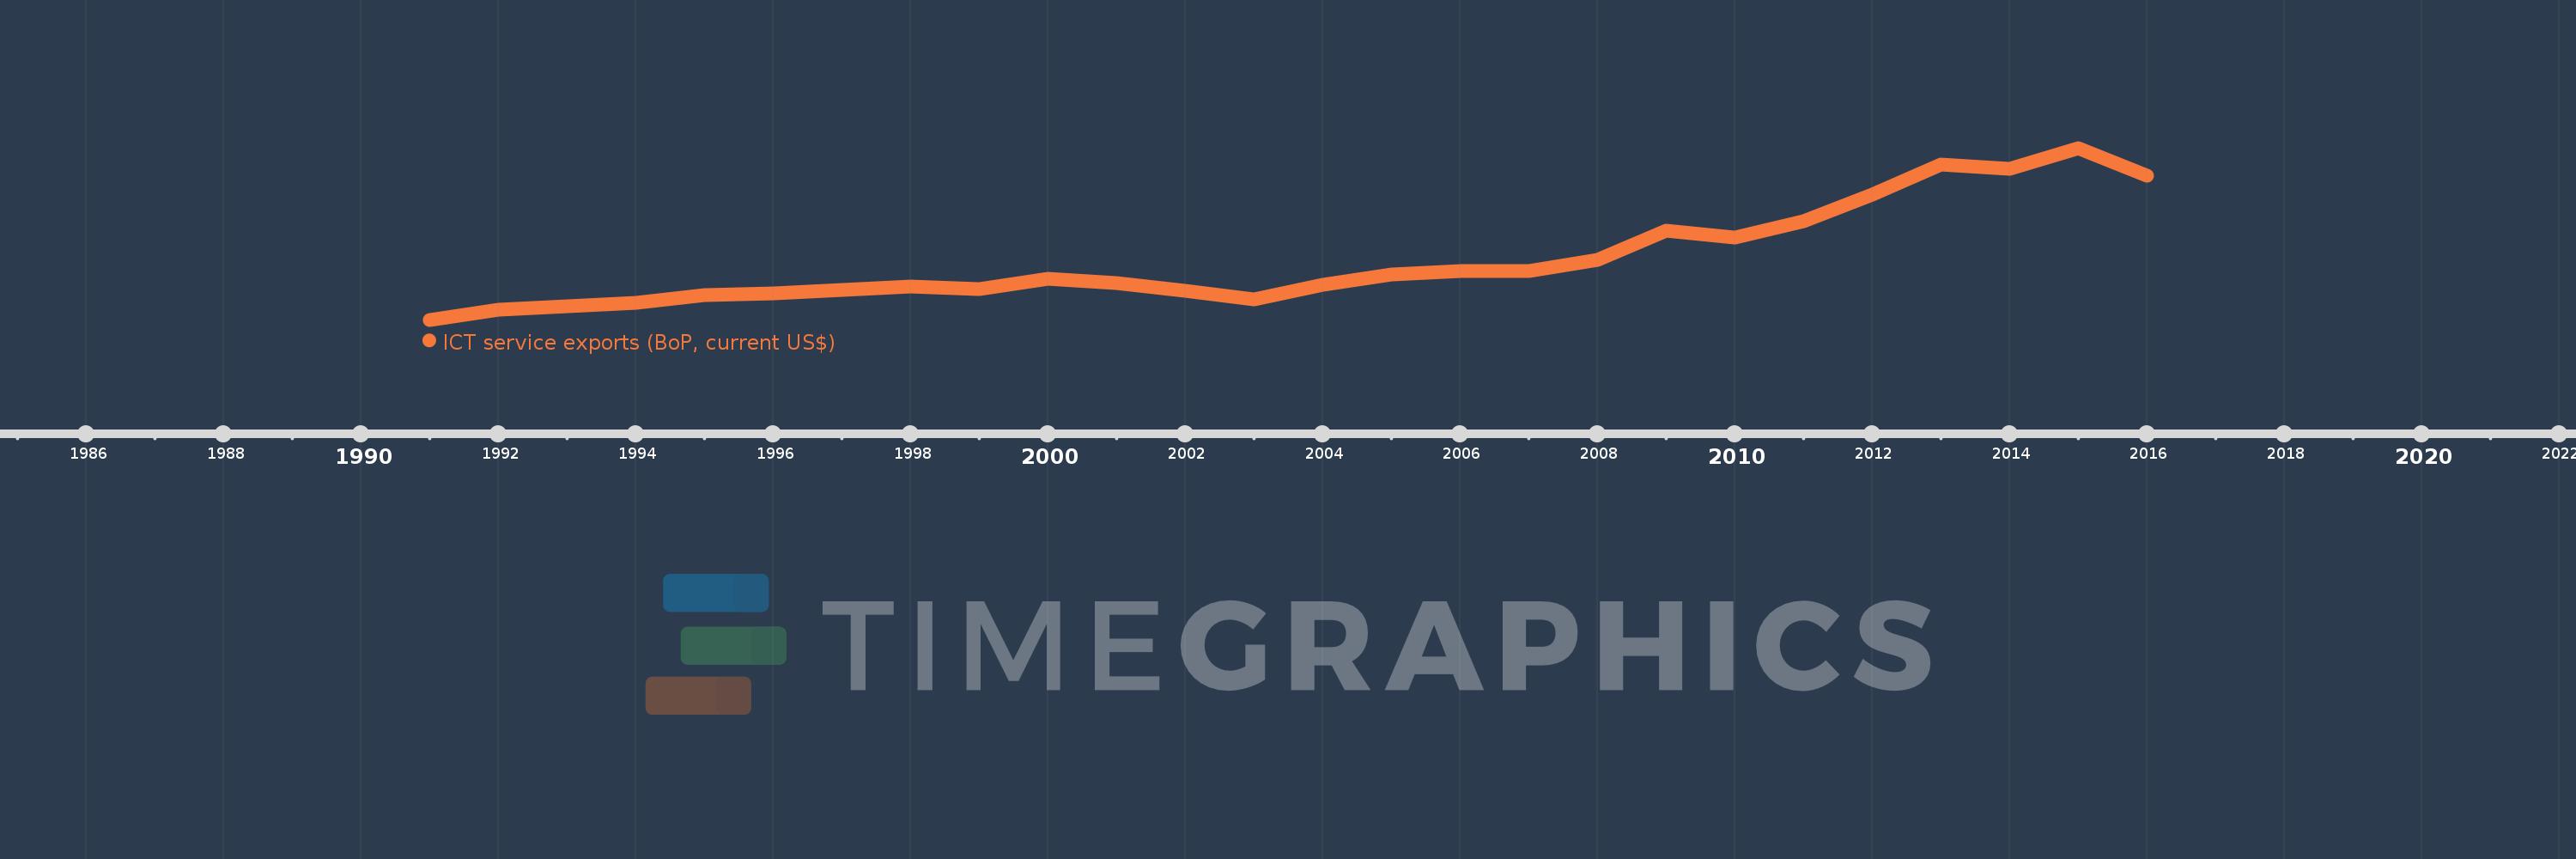
Cette échelle de temps montre un graphique de 1991 année à 2016 année Peru. Les données jusqu'à 1990 année ne sont pas présentés. Quantité d'observations actuelles selon dates: 26.

Source (désignation):

Les indicateurs du développement mondiale

Source (organisation):

International Monetary Fund, Balance of Payments Statistics Yearbook and data files.

Catégories:

Economy & Growth, Infrastructure, Trade

Dernière mise à jour

23 avr. 2017

Les indicateurs de changement de valeurs selon les années

En moyenne:
322.61 mln.
Minimum:
107.0 mln.
1 janv. 1991
Maximum:
722.622 mln.
1 janv. 2015
Pour la date d''observation
Valeur
Changement absolu
Le changement par rapport à la valeur précédente
1 janv. 1991
107.0 mln.
+107.0 mln.
0.0%
1 janv. 1992
142.0 mln.
+35.0 mln.
32.71%
1 janv. 1993
154.0 mln.
+12.0 mln.
8.45%
1 janv. 1994
166.4 mln.
+12.4 mln.
8.05%
1 janv. 1995
194.8 mln.
+28.4 mln.
17.07%
1 janv. 1996
200.146 mln.
+5.346 mln.
2.74%
1 janv. 1997
215.041 mln.
+14.895 mln.
7.44%
1 janv. 1998
225.443 mln.
+10.402 mln.
4.84%
1 janv. 1999
216.835 mln.
-8.608 mln.
-3.82%
1 janv. 2000
252.581 mln.
+35.746 mln.
16.49%
1 janv. 2001
239.3 mln.
-13.281 mln.
-5.26%
1 janv. 2002
209.901 mln.
-29.399 mln.
-12.29%
1 janv. 2003
180.671 mln.
-29.23 mln.
-13.93%
1 janv. 2004
230.825 mln.
+50.154 mln.
27.76%
1 janv. 2005
269.792 mln.
+38.967 mln.
16.88%
1 janv. 2006
280.227 mln.
+10.436 mln.
3.87%
1 janv. 2007
281.857 mln.
+1.63 mln.
0.58%
1 janv. 2008
321.179 mln.
+39.322 mln.
13.95%
1 janv. 2009
425.649 mln.
+104.47 mln.
32.53%
1 janv. 2010
403.048 mln.
-22.601 mln.
-5.31%
1 janv. 2011
458.554 mln.
+55.506 mln.
13.77%
1 janv. 2012
557.013 mln.
+98.459 mln.
21.47%
1 janv. 2013
661.944 mln.
+104.931 mln.
18.84%
1 janv. 2014
646.88 mln.
-15.063 mln.
-2.28%
1 janv. 2015
722.622 mln.
+75.742 mln.
11.71%
1 janv. 2016
624.162 mln.
-98.46 mln.
-13.63%

Classement des pays selon les statistiques actuelles par années