29
/fr/
fr
AIzaSyAYiBZKx7MnpbEhh9jyipgxe19OcubqV5w
April 1, 2024
132095
Fiji
FJI
true
2
1
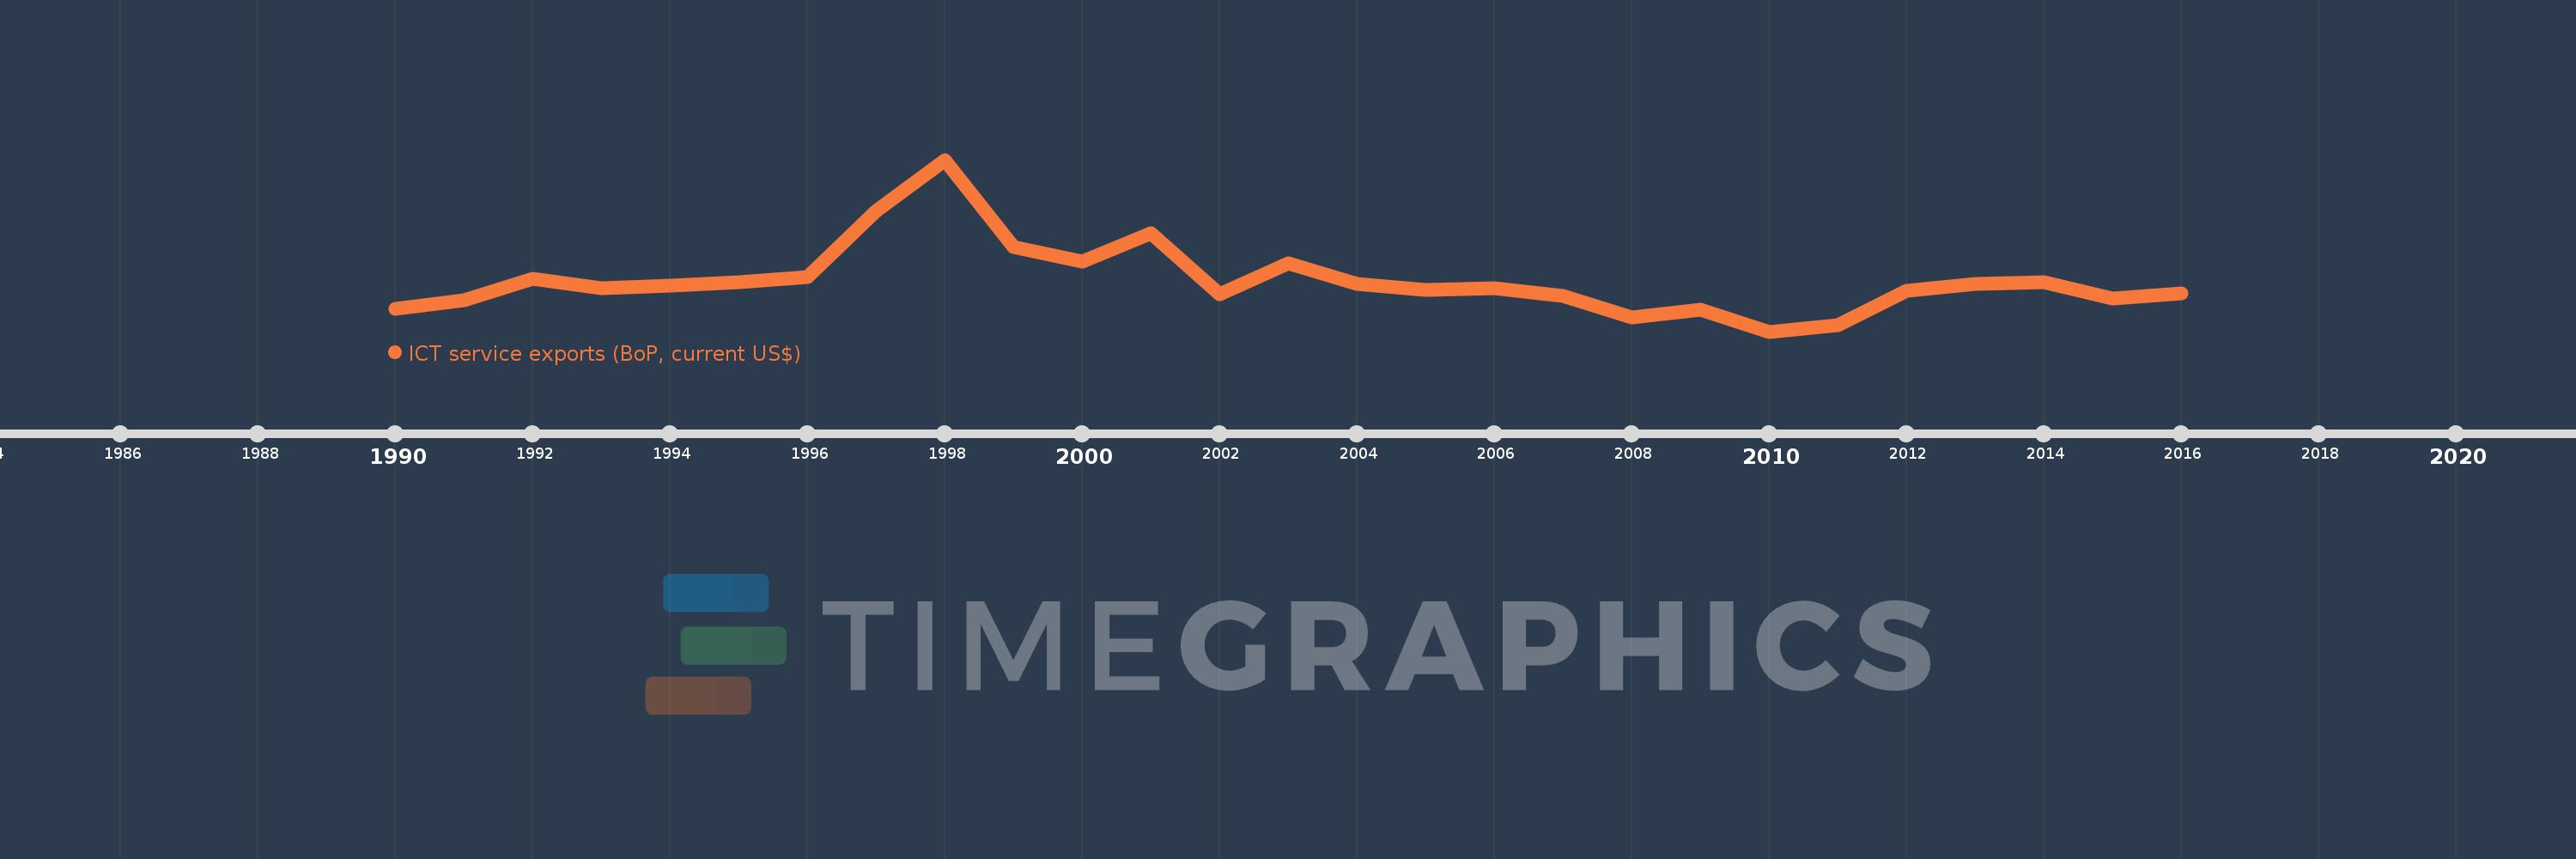
ICT service exports (BoP, current US$)
2016,2015,2014,2013,2012,2011,2010,2009,2008,2007,2006,2005,2004,2003,2002,2001,2000,1999,1998,1997,1996,1995,1994,1993,1992,1991,1990
Cette statistique dans les autres pays:
AfghanistanAlbaniaAlgeriaAngolaAntigua and BarbudaArab WorldArgentinaArmeniaArubaAustraliaAustriaAzerbaijanBahrainBangladeshBarbadosBelarusBelgiumBelizeBeninBermudaBhutanBoliviaBosnia and HerzegovinaBotswanaBrazilBrunei DarussalamBulgariaBurkina FasoBurundiCabo VerdeCambodiaCameroonCanadaCaribbean small statesCentral Europe and the BalticsChileChinaColombiaComorosCongo, Dem. Rep.Congo, Rep.Costa RicaCote d'IvoireCroatiaCuracaoCyprusCzech RepublicDenmarkDjiboutiDominicaDominican RepublicEarly-demographic dividendEast Asia & PacificEast Asia & Pacific (excluding high income)East Asia & Pacific (IDA & IBRD countries)EcuadorEgypt, Arab Rep.El SalvadorEritreaEstoniaEthiopiaEuro areaEurope & Central AsiaEurope & Central Asia (excluding high income)Europe & Central Asia (IDA & IBRD countries)European UnionFaroe IslandsFijiFinlandFragile and conflict affected situationsFranceFrench PolynesiaGabonGambia, TheGeorgiaGermanyGreeceGrenadaGuatemalaGuineaGuinea-BissauGuyanaHeavily indebted poor countries (HIPC)High incomeHondurasHong Kong SAR, ChinaHungaryIBRD onlyIcelandIDA & IBRD totalIDA blendIDA onlyIDA totalIndiaIndonesiaIraqIrelandIsraelItalyJamaicaJapanJordanKazakhstanKenyaKorea, Rep.KosovoKuwaitKyrgyz RepublicLao PDRLate-demographic dividendLatin America & Caribbean Latin America & Caribbean (excluding high income)Latin America & the Caribbean (IDA & IBRD countries)LatviaLeast developed countries: UN classificationLebanonLesothoLithuaniaLow & middle incomeLow incomeLower middle incomeLuxembourgMacao SAR, ChinaMacedonia, FYRMadagascarMalawiMalaysiaMaliMaltaMauritaniaMauritiusMexicoMicronesia, Fed. Sts.Middle East & North AfricaMiddle East & North Africa (excluding high income)Middle East & North Africa (IDA & IBRD countries)Middle incomeMoldovaMongoliaMontenegroMoroccoMozambiqueMyanmarNamibiaNepalNetherlandsNew CaledoniaNew ZealandNicaraguaNigerNigeriaNorth AmericaNorwayOECD membersOmanPacific island small statesPakistanPalauPanamaPapua New GuineaParaguayPeruPhilippinesPolandPortugalPost-demographic dividendPre-demographic dividendRomaniaRussian FederationRwandaSamoaSao Tome and PrincipeSaudi ArabiaSenegalSerbiaSeychellesSierra LeoneSingaporeSint Maarten (Dutch part)Slovak RepublicSloveniaSmall statesSolomon IslandsSouth AfricaSouth AsiaSouth Asia (IDA & IBRD)South SudanSpainSri LankaSt. Kitts and NevisSt. LuciaSt. Vincent and the GrenadinesSub-Saharan Africa Sub-Saharan Africa (excluding high income)Sub-Saharan Africa (IDA & IBRD countries)SudanSurinameSwazilandSwedenSwitzerlandSyrian Arab RepublicTajikistanTanzaniaThailandTogoTongaTrinidad and TobagoTunisiaTurkeyTuvaluUgandaUkraineUnited KingdomUnited StatesUpper middle incomeUruguayVanuatuVenezuela, RBWest Bank and GazaWorldYemen, Rep.ZambiaZimbabwe La ligne de temps
Cette échelle de temps montre un graphique de 1990 année à 2016 année Fiji. Les données jusqu'à 1989 année ne sont pas présentés. Quantité d'observations actuelles selon dates: 27.
Source (désignation):
Les indicateurs du développement mondiale
Source (organisation):
International Monetary Fund, Balance of Payments Statistics Yearbook and data files.
Catégories:
Economy & Growth, Infrastructure, Trade
Dernière mise à jour
23 avr. 2017
Les indicateurs de changement de valeurs selon les années
Minimum:
25.604 mln.
1 janv. 2010
Maximum:
122.396 mln.
1 janv. 1998
Pour la date d''observation
Valeur
Changement absolu
Le changement par rapport à la valeur précédente
1 janv. 1990
38.629 mln.
+38.629 mln.
0.0%
1 janv. 1991
43.149 mln.
+4.52 mln.
11.7%
1 janv. 1992
55.572 mln.
+12.423 mln.
28.79%
1 janv. 1993
50.1 mln.
-5.472 mln.
-9.85%
1 janv. 1994
51.564 mln.
+1.464 mln.
2.92%
1 janv. 1995
53.274 mln.
+1.71 mln.
3.32%
1 janv. 1996
56.174 mln.
+2.9 mln.
5.44%
1 janv. 1997
93.779 mln.
+37.605 mln.
66.94%
1 janv. 1998
122.396 mln.
+28.617 mln.
30.52%
1 janv. 1999
73.182 mln.
-49.214 mln.
-40.21%
1 janv. 2000
64.987 mln.
-8.195 mln.
-11.2%
1 janv. 2001
81.09 mln.
+16.103 mln.
24.78%
1 janv. 2002
46.558 mln.
-34.531 mln.
-42.58%
1 janv. 2003
64.047 mln.
+17.488 mln.
37.56%
1 janv. 2004
52.543 mln.
-11.504 mln.
-17.96%
1 janv. 2005
49.056 mln.
-3.487 mln.
-6.64%
1 janv. 2006
50.135 mln.
+1.079 mln.
2.2%
1 janv. 2007
45.766 mln.
-4.369 mln.
-8.71%
1 janv. 2008
33.354 mln.
-12.412 mln.
-27.12%
1 janv. 2009
37.762 mln.
+4.408 mln.
13.21%
1 janv. 2010
25.604 mln.
-12.158 mln.
-32.2%
1 janv. 2011
29.236 mln.
+3.632 mln.
14.19%
1 janv. 2012
48.811 mln.
+19.575 mln.
66.95%
1 janv. 2013
52.541 mln.
+3.731 mln.
7.64%
1 janv. 2014
53.405 mln.
+863.938 milles
1.64%
1 janv. 2015
44.11 mln.
-9.295 mln.
-17.4%
1 janv. 2016
47.166 mln.
+3.056 mln.
6.93%
Classement des pays selon les statistiques actuelles par années


Commentaires: