30
/fr/
AIzaSyAYiBZKx7MnpbEhh9jyipgxe19OcubqV5w
April 1, 2024
84203
Benin
BEN
true
2
1
ICT service exports (BoP, current US$)
2015,2014,2013,2012,2011,2010,2009,2008,2007,2006,2005,2004,2003,2002,2001,2000,1999,1998,1997,1996,1995,1994,1993,1991,1990,1989
Download
Bibliothèque de statistiques globales →Benin →

ICT service exports (BoP, current US$)

Cette statistique dans les autres pays:

AfghanistanAlbaniaAlgeriaAngolaAntigua and BarbudaArab WorldArgentinaArmeniaArubaAustraliaAustriaAzerbaijanBahrainBangladeshBarbadosBelarusBelgiumBelizeBeninBermudaBhutanBoliviaBosnia and HerzegovinaBotswanaBrazilBrunei DarussalamBulgariaBurkina FasoBurundiCabo VerdeCambodiaCameroonCanadaCaribbean small statesCentral Europe and the BalticsChileChinaColombiaComorosCongo, Dem. Rep.Congo, Rep.Costa RicaCote d'IvoireCroatiaCuracaoCyprusCzech RepublicDenmarkDjiboutiDominicaDominican RepublicEarly-demographic dividendEast Asia & PacificEast Asia & Pacific (excluding high income)East Asia & Pacific (IDA & IBRD countries)EcuadorEgypt, Arab Rep.El SalvadorEritreaEstoniaEthiopiaEuro areaEurope & Central AsiaEurope & Central Asia (excluding high income)Europe & Central Asia (IDA & IBRD countries)European UnionFaroe IslandsFijiFinlandFragile and conflict affected situationsFranceFrench PolynesiaGabonGambia, TheGeorgiaGermanyGreeceGrenadaGuatemalaGuineaGuinea-BissauGuyanaHeavily indebted poor countries (HIPC)High incomeHondurasHong Kong SAR, ChinaHungaryIBRD onlyIcelandIDA & IBRD totalIDA blendIDA onlyIDA totalIndiaIndonesiaIraqIrelandIsraelItalyJamaicaJapanJordanKazakhstanKenyaKorea, Rep.KosovoKuwaitKyrgyz RepublicLao PDRLate-demographic dividendLatin America & Caribbean Latin America & Caribbean (excluding high income)Latin America & the Caribbean (IDA & IBRD countries)LatviaLeast developed countries: UN classificationLebanonLesothoLithuaniaLow & middle incomeLow incomeLower middle incomeLuxembourgMacao SAR, ChinaMacedonia, FYRMadagascarMalawiMalaysiaMaliMaltaMauritaniaMauritiusMexicoMicronesia, Fed. Sts.Middle East & North AfricaMiddle East & North Africa (excluding high income)Middle East & North Africa (IDA & IBRD countries)Middle incomeMoldovaMongoliaMontenegroMoroccoMozambiqueMyanmarNamibiaNepalNetherlandsNew CaledoniaNew ZealandNicaraguaNigerNigeriaNorth AmericaNorwayOECD membersOmanPacific island small statesPakistanPalauPanamaPapua New GuineaParaguayPeruPhilippinesPolandPortugalPost-demographic dividendPre-demographic dividendRomaniaRussian FederationRwandaSamoaSao Tome and PrincipeSaudi ArabiaSenegalSerbiaSeychellesSierra LeoneSingaporeSint Maarten (Dutch part)Slovak RepublicSloveniaSmall statesSolomon IslandsSouth AfricaSouth AsiaSouth Asia (IDA & IBRD)South SudanSpainSri LankaSt. Kitts and NevisSt. LuciaSt. Vincent and the GrenadinesSub-Saharan Africa Sub-Saharan Africa (excluding high income)Sub-Saharan Africa (IDA & IBRD countries)SudanSurinameSwazilandSwedenSwitzerlandSyrian Arab RepublicTajikistanTanzaniaThailandTogoTongaTrinidad and TobagoTunisiaTurkeyTuvaluUgandaUkraineUnited KingdomUnited StatesUpper middle incomeUruguayVanuatuVenezuela, RBWest Bank and GazaWorldYemen, Rep.ZambiaZimbabwe

La ligne de temps

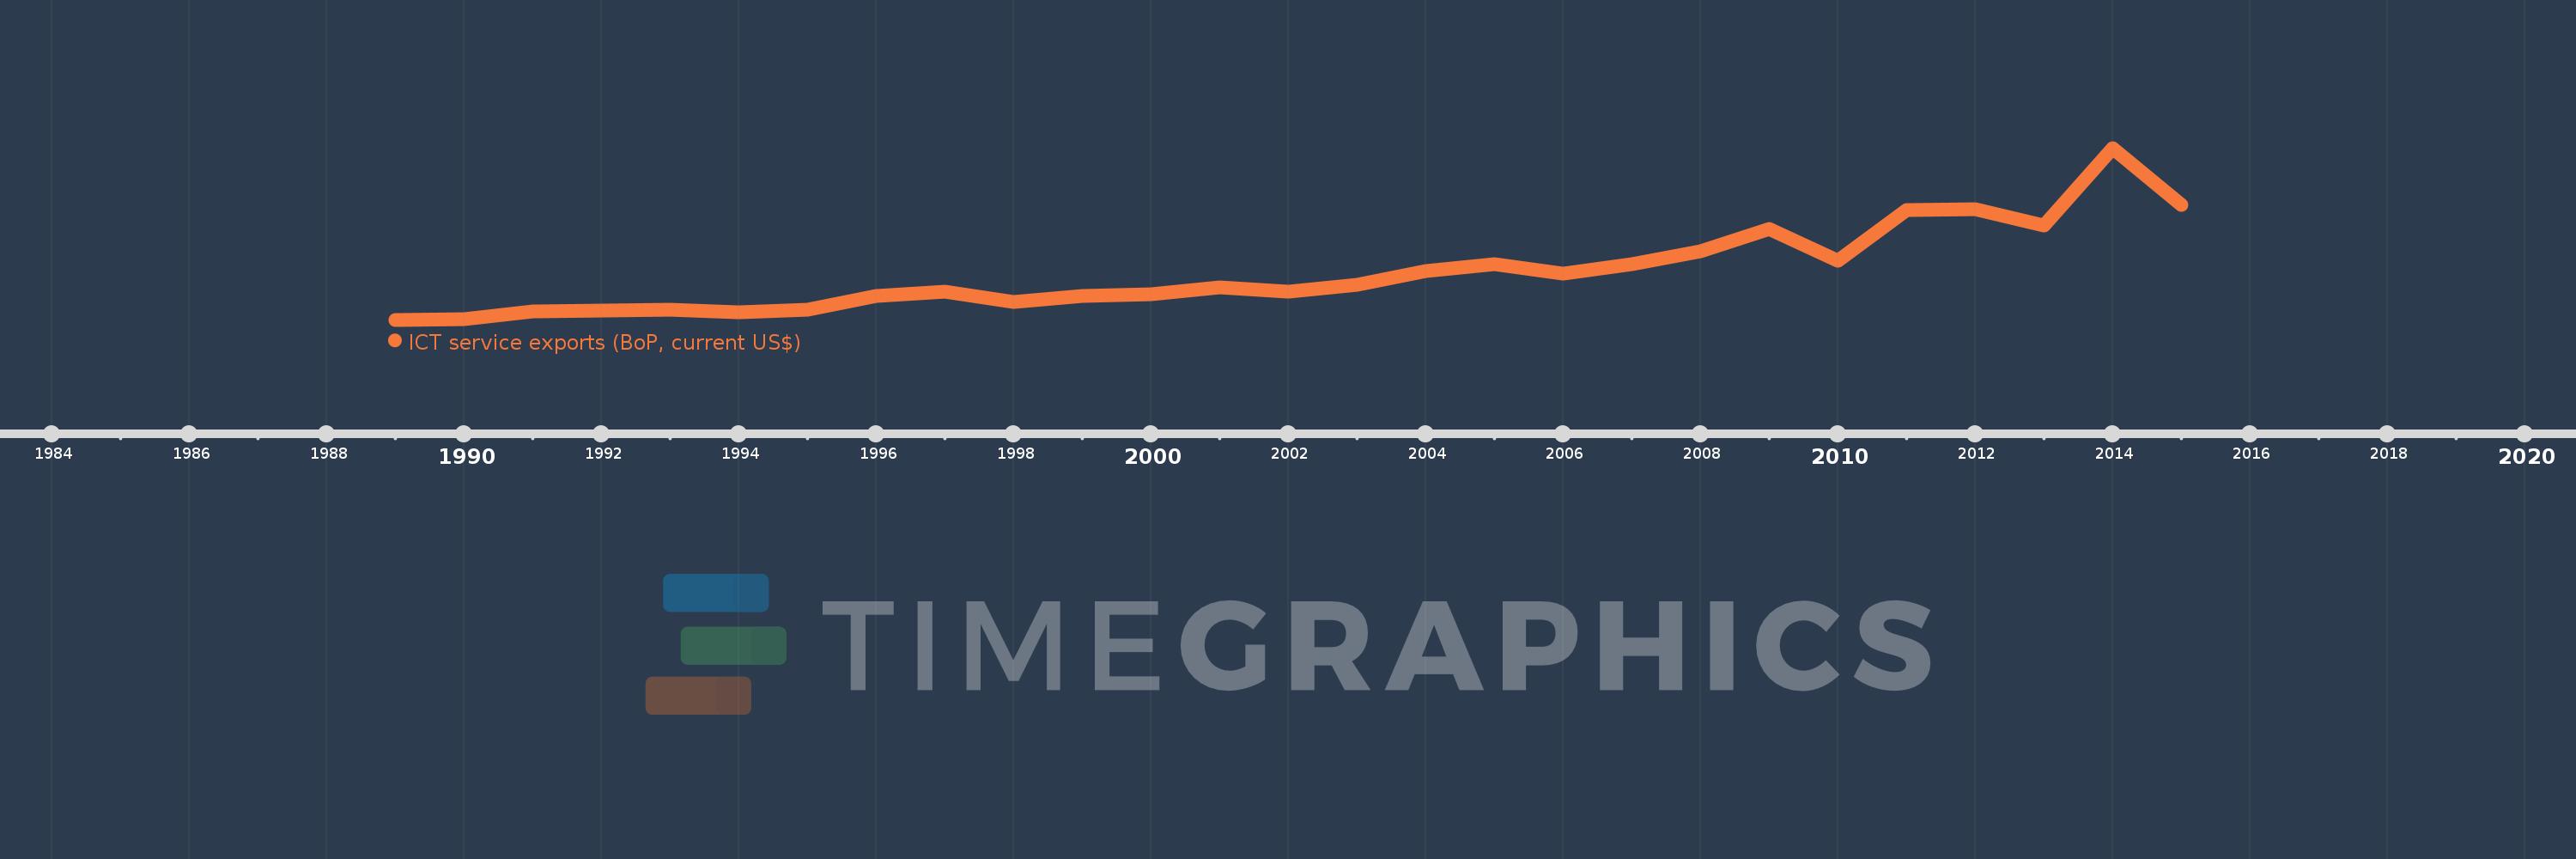
Cette échelle de temps montre un graphique de 1989 année à 2015 année Benin. Les données jusqu'à 1988 année ne sont pas présentés. Quantité d'observations actuelles selon dates: 26.

Source (désignation):

Les indicateurs du développement mondiale

Source (organisation):

International Monetary Fund, Balance of Payments Statistics Yearbook and data files.

Catégories:

Economy & Growth, Infrastructure, Trade

Dernière mise à jour

23 avr. 2017

Les indicateurs de changement de valeurs selon les années

En moyenne:
41.054 mln.
Minimum:
4.445 mln.
1 janv. 1989
Maximum:
132.792 mln.
1 janv. 2014
Pour la date d''observation
Valeur
Changement absolu
Le changement par rapport à la valeur précédente
1 janv. 1989
4.445 mln.
+4.445 mln.
0.0%
1 janv. 1990
4.846 mln.
+401.052 milles
9.02%
1 janv. 1991
10.427 mln.
+5.58 mln.
115.15%
1 janv. 1993
11.926 mln.
+1.499 mln.
14.38%
1 janv. 1994
9.763 mln.
-2.163 mln.
-18.14%
1 janv. 1995
11.839 mln.
+2.077 mln.
21.27%
1 janv. 1996
22.53 mln.
+10.691 mln.
90.3%
1 janv. 1997
25.211 mln.
+2.682 mln.
11.9%
1 janv. 1998
17.438 mln.
-7.774 mln.
-30.83%
1 janv. 1999
21.924 mln.
+4.486 mln.
25.72%
1 janv. 2000
23.193 mln.
+1.269 mln.
5.79%
1 janv. 2001
28.334 mln.
+5.141 mln.
22.16%
1 janv. 2002
25.378 mln.
-2.956 mln.
-10.43%
1 janv. 2003
30.719 mln.
+5.341 mln.
21.05%
1 janv. 2004
41.041 mln.
+10.322 mln.
33.6%
1 janv. 2005
46.034 mln.
+4.993 mln.
12.17%
1 janv. 2006
38.89 mln.
-7.144 mln.
-15.52%
1 janv. 2007
46.069 mln.
+7.179 mln.
18.46%
1 janv. 2008
55.572 mln.
+9.503 mln.
20.63%
1 janv. 2009
71.989 mln.
+16.416 mln.
29.54%
1 janv. 2010
48.606 mln.
-23.383 mln.
-32.48%
1 janv. 2011
86.705 mln.
+38.099 mln.
78.38%
1 janv. 2012
86.953 mln.
+247.619 milles
0.29%
1 janv. 2013
74.655 mln.
-12.297 mln.
-14.14%
1 janv. 2014
132.792 mln.
+58.137 mln.
77.87%
1 janv. 2015
90.113 mln.
-42.679 mln.
-32.14%

Classement des pays selon les statistiques actuelles par années