29
/fr/
fr
AIzaSyAYiBZKx7MnpbEhh9jyipgxe19OcubqV5w
April 1, 2024
104983
Chile
CHL
true
2
1
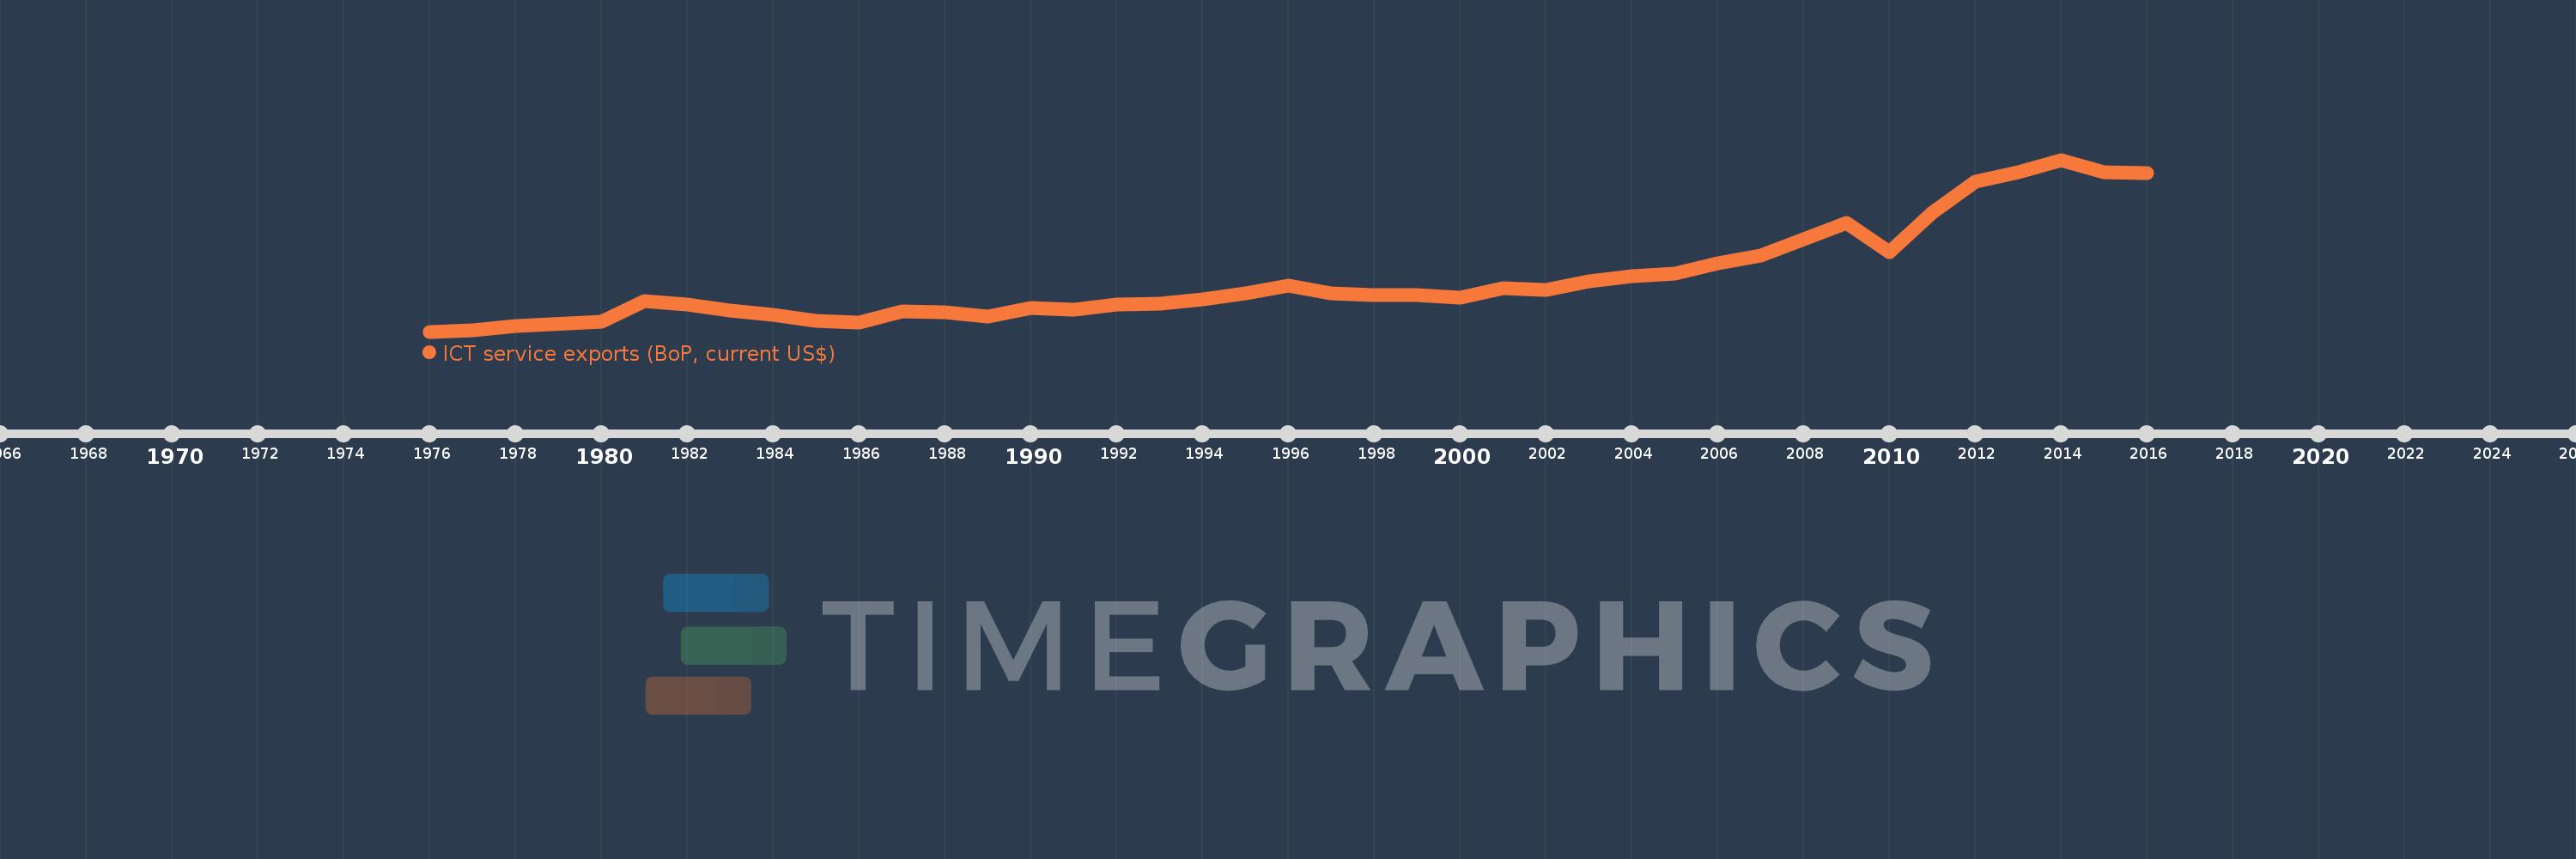
ICT service exports (BoP, current US$)
2016,2015,2014,2013,2012,2011,2010,2009,2008,2007,2006,2005,2004,2003,2002,2001,2000,1999,1998,1997,1996,1995,1994,1993,1992,1991,1990,1989,1988,1987,1986,1985,1984,1983,1982,1981,1980,1978,1977,1976
Cette statistique dans les autres pays:
AfghanistanAlbaniaAlgeriaAngolaAntigua and BarbudaArab WorldArgentinaArmeniaArubaAustraliaAustriaAzerbaijanBahrainBangladeshBarbadosBelarusBelgiumBelizeBeninBermudaBhutanBoliviaBosnia and HerzegovinaBotswanaBrazilBrunei DarussalamBulgariaBurkina FasoBurundiCabo VerdeCambodiaCameroonCanadaCaribbean small statesCentral Europe and the BalticsChileChinaColombiaComorosCongo, Dem. Rep.Congo, Rep.Costa RicaCote d'IvoireCroatiaCuracaoCyprusCzech RepublicDenmarkDjiboutiDominicaDominican RepublicEarly-demographic dividendEast Asia & PacificEast Asia & Pacific (excluding high income)East Asia & Pacific (IDA & IBRD countries)EcuadorEgypt, Arab Rep.El SalvadorEritreaEstoniaEthiopiaEuro areaEurope & Central AsiaEurope & Central Asia (excluding high income)Europe & Central Asia (IDA & IBRD countries)European UnionFaroe IslandsFijiFinlandFragile and conflict affected situationsFranceFrench PolynesiaGabonGambia, TheGeorgiaGermanyGreeceGrenadaGuatemalaGuineaGuinea-BissauGuyanaHeavily indebted poor countries (HIPC)High incomeHondurasHong Kong SAR, ChinaHungaryIBRD onlyIcelandIDA & IBRD totalIDA blendIDA onlyIDA totalIndiaIndonesiaIraqIrelandIsraelItalyJamaicaJapanJordanKazakhstanKenyaKorea, Rep.KosovoKuwaitKyrgyz RepublicLao PDRLate-demographic dividendLatin America & Caribbean Latin America & Caribbean (excluding high income)Latin America & the Caribbean (IDA & IBRD countries)LatviaLeast developed countries: UN classificationLebanonLesothoLithuaniaLow & middle incomeLow incomeLower middle incomeLuxembourgMacao SAR, ChinaMacedonia, FYRMadagascarMalawiMalaysiaMaliMaltaMauritaniaMauritiusMexicoMicronesia, Fed. Sts.Middle East & North AfricaMiddle East & North Africa (excluding high income)Middle East & North Africa (IDA & IBRD countries)Middle incomeMoldovaMongoliaMontenegroMoroccoMozambiqueMyanmarNamibiaNepalNetherlandsNew CaledoniaNew ZealandNicaraguaNigerNigeriaNorth AmericaNorwayOECD membersOmanPacific island small statesPakistanPalauPanamaPapua New GuineaParaguayPeruPhilippinesPolandPortugalPost-demographic dividendPre-demographic dividendRomaniaRussian FederationRwandaSamoaSao Tome and PrincipeSaudi ArabiaSenegalSerbiaSeychellesSierra LeoneSingaporeSint Maarten (Dutch part)Slovak RepublicSloveniaSmall statesSolomon IslandsSouth AfricaSouth AsiaSouth Asia (IDA & IBRD)South SudanSpainSri LankaSt. Kitts and NevisSt. LuciaSt. Vincent and the GrenadinesSub-Saharan Africa Sub-Saharan Africa (excluding high income)Sub-Saharan Africa (IDA & IBRD countries)SudanSurinameSwazilandSwedenSwitzerlandSyrian Arab RepublicTajikistanTanzaniaThailandTogoTongaTrinidad and TobagoTunisiaTurkeyTuvaluUgandaUkraineUnited KingdomUnited StatesUpper middle incomeUruguayVanuatuVenezuela, RBWest Bank and GazaWorldYemen, Rep.ZambiaZimbabwe La ligne de temps
Cette échelle de temps montre un graphique de 1976 année à 2016 année Chile. Les données jusqu'à 1975 année ne sont pas présentés. Quantité d'observations actuelles selon dates: 40.
Source (désignation):
Les indicateurs du développement mondiale
Source (organisation):
International Monetary Fund, Balance of Payments Statistics Yearbook and data files.
Catégories:
Economy & Growth, Infrastructure, Trade
Dernière mise à jour
23 avr. 2017
Les indicateurs de changement de valeurs selon les années
Minimum:
50.0 mln.
1 janv. 1976
Maximum:
3.218 mds
1 janv. 2014
Pour la date d''observation
Valeur
Changement absolu
Le changement par rapport à la valeur précédente
1 janv. 1976
50.0 mln.
+50.0 mln.
0.0%
1 janv. 1977
71.0 mln.
+21.0 mln.
42.0%
1 janv. 1978
147.0 mln.
+76.0 mln.
107.04%
1 janv. 1980
231.0 mln.
+84.0 mln.
57.14%
1 janv. 1981
610.0 mln.
+379.0 mln.
164.07%
1 janv. 1982
545.0 mln.
-65.0 mln.
-10.66%
1 janv. 1983
443.0 mln.
-102.0 mln.
-18.72%
1 janv. 1984
366.0 mln.
-77.0 mln.
-17.38%
1 janv. 1985
242.0 mln.
-124.0 mln.
-33.88%
1 janv. 1986
210.8 mln.
-31.2 mln.
-12.89%
1 janv. 1987
426.9 mln.
+216.1 mln.
102.51%
1 janv. 1988
403.1 mln.
-23.8 mln.
-5.58%
1 janv. 1989
331.4 mln.
-71.7 mln.
-17.79%
1 janv. 1990
490.1 mln.
+158.7 mln.
47.89%
1 janv. 1991
452.3 mln.
-37.8 mln.
-7.71%
1 janv. 1992
546.0 mln.
+93.7 mln.
20.72%
1 janv. 1993
568.0 mln.
+22.0 mln.
4.03%
1 janv. 1994
642.9 mln.
+74.9 mln.
13.19%
1 janv. 1995
751.3 mln.
+108.4 mln.
16.86%
1 janv. 1996
902.0 mln.
+150.7 mln.
20.06%
1 janv. 1997
757.223 mln.
-144.777 mln.
-16.05%
1 janv. 1998
723.074 mln.
-34.149 mln.
-4.51%
1 janv. 1999
716.581 mln.
-6.493 mln.
-0.9%
1 janv. 2000
682.52 mln.
-34.061 mln.
-4.75%
1 janv. 2001
842.304 mln.
+159.784 mln.
23.41%
1 janv. 2002
819.532 mln.
-22.772 mln.
-2.7%
1 janv. 2003
969.999 mln.
+150.467 mln.
18.36%
1 janv. 2004
1.069 mds
+99.371 mln.
10.24%
1 janv. 2005
1.123 mds
+53.64 mln.
5.02%
1 janv. 2006
1.309 mds
+186.311 mln.
16.59%
1 janv. 2007
1.458 mds
+148.293 mln.
11.33%
1 janv. 2008
1.75 mds
+292.783 mln.
20.09%
1 janv. 2009
2.06 mds
+309.119 mln.
17.66%
1 janv. 2010
1.518 mds
-541.696 mln.
-26.3%
1 janv. 2011
2.251 mds
+733.553 mln.
48.33%
1 janv. 2012
2.818 mds
+567.113 mln.
25.19%
1 janv. 2013
2.984 mds
+165.095 mln.
5.86%
1 janv. 2014
3.218 mds
+234.627 mln.
7.86%
1 janv. 2015
2.992 mds
-225.934 mln.
-7.02%
1 janv. 2016
2.968 mds
-23.779 mln.
-0.79%
Classement des pays selon les statistiques actuelles par années


Commentaires: