29
/fr/
fr
AIzaSyAYiBZKx7MnpbEhh9jyipgxe19OcubqV5w
April 1, 2024
86776
Bolivia
BOL
true
2
1
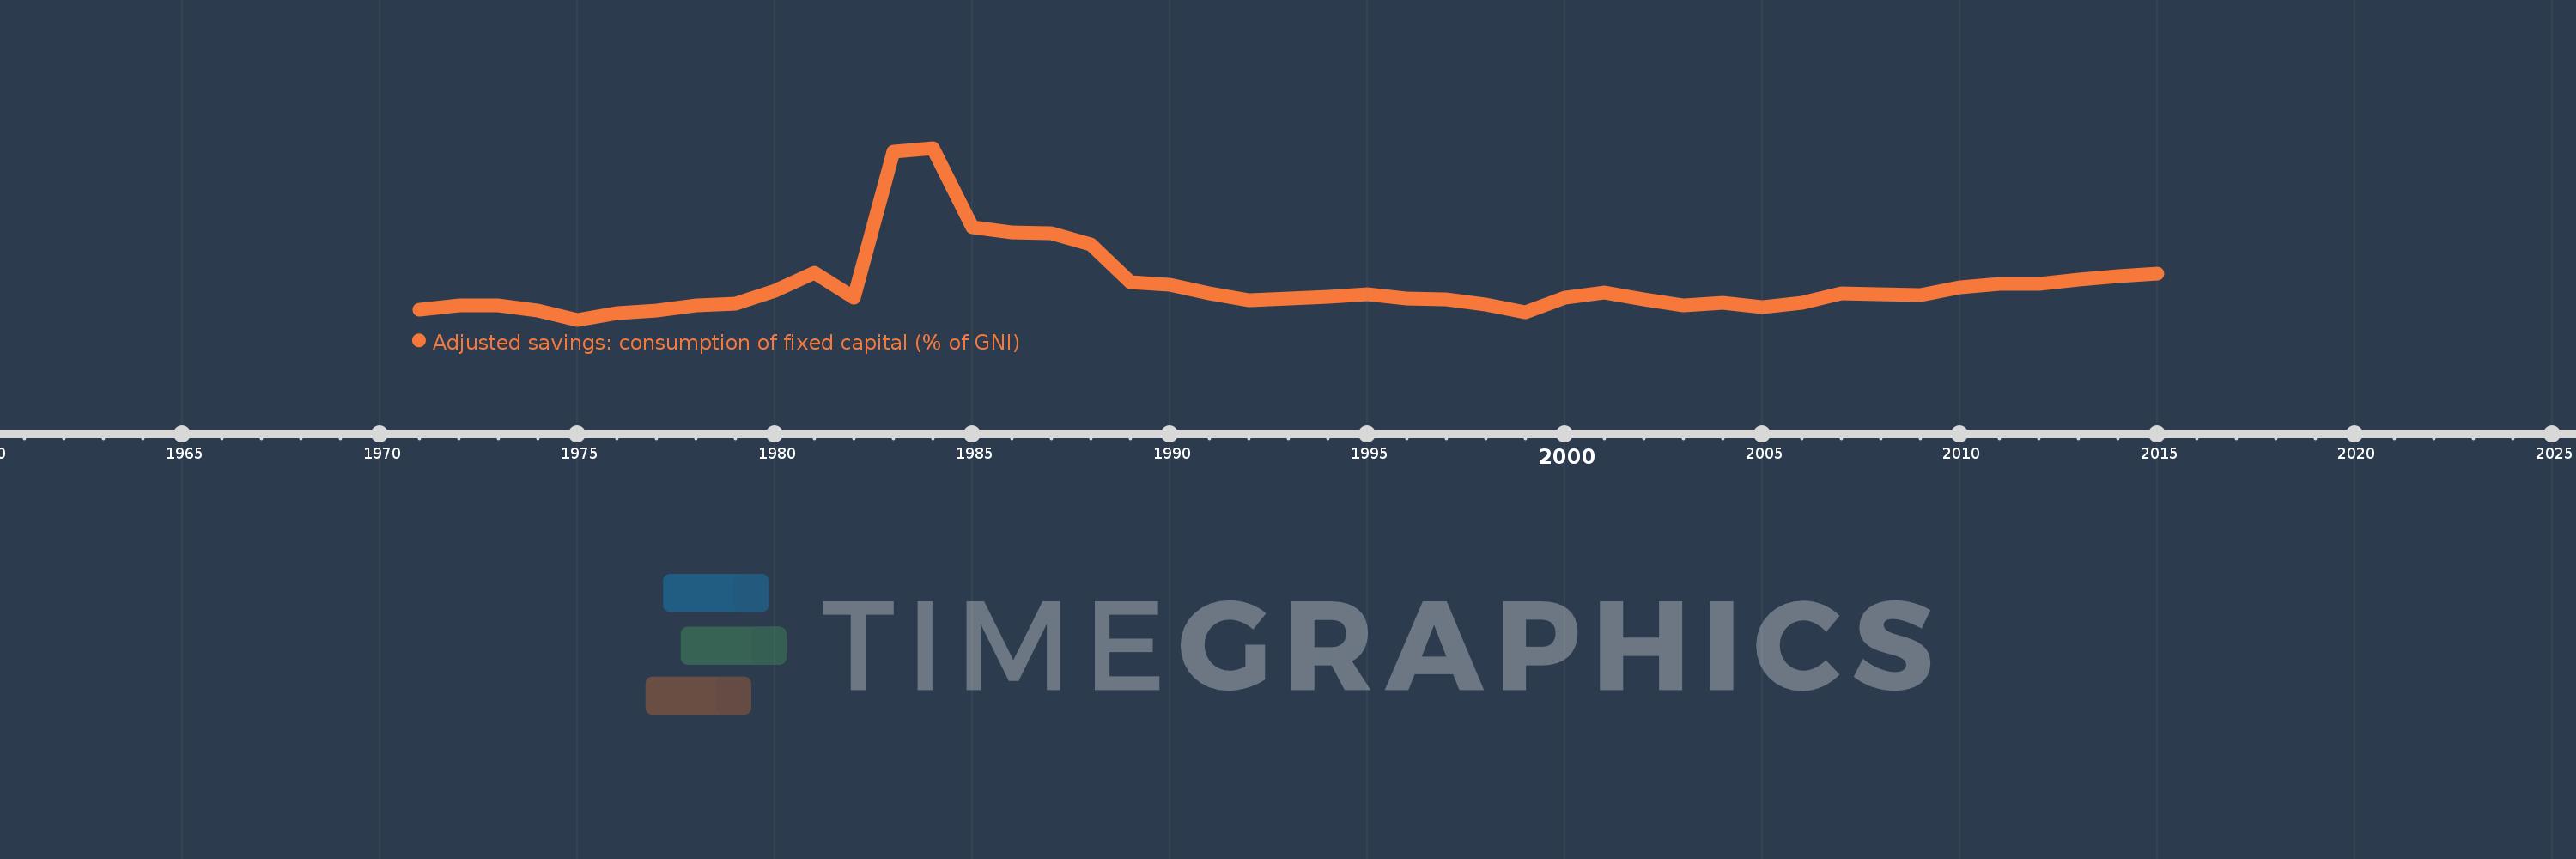
Adjusted savings: consumption of fixed capital (% of GNI)
2015,2014,2013,2012,2011,2010,2009,2008,2007,2006,2005,2004,2003,2002,2001,2000,1999,1998,1997,1996,1995,1994,1993,1992,1991,1990,1989,1988,1987,1986,1985,1984,1983,1982,1981,1980,1979,1978,1977,1976,1975,1974,1973,1972,1971
Cette statistique dans les autres pays:
AfghanistanAlbaniaAlgeriaAndorraAngolaAntigua and BarbudaArab WorldArgentinaArmeniaAustraliaAustriaAzerbaijanBahamas, TheBahrainBangladeshBarbadosBelarusBelgiumBelizeBeninBermudaBhutanBoliviaBosnia and HerzegovinaBotswanaBrazilBrunei DarussalamBulgariaBurkina FasoBurundiCabo VerdeCambodiaCameroonCanadaCaribbean small statesCentral African RepublicCentral Europe and the BalticsChadChileChinaColombiaComorosCongo, Dem. Rep.Congo, Rep.Costa RicaCote d'IvoireCroatiaCubaCyprusCzech RepublicDenmarkDjiboutiDominicaDominican RepublicEarly-demographic dividendEast Asia & PacificEast Asia & Pacific (excluding high income)East Asia & Pacific (IDA & IBRD countries)EcuadorEgypt, Arab Rep.El SalvadorEquatorial GuineaEritreaEstoniaEthiopiaEuro areaEurope & Central AsiaEurope & Central Asia (excluding high income)Europe & Central Asia (IDA & IBRD countries)European UnionFijiFinlandFragile and conflict affected situationsFranceGabonGambia, TheGeorgiaGermanyGhanaGreeceGreenlandGrenadaGuatemalaGuineaGuinea-BissauGuyanaHaitiHeavily indebted poor countries (HIPC)High incomeHondurasHong Kong SAR, ChinaHungaryIBRD onlyIcelandIDA & IBRD totalIDA blendIDA onlyIDA totalIndiaIndonesiaIran, Islamic Rep.IraqIrelandIsraelItalyJamaicaJapanJordanKazakhstanKenyaKiribatiKorea, Rep.KosovoKuwaitKyrgyz RepublicLao PDRLate-demographic dividendLatin America & Caribbean Latin America & Caribbean (excluding high income)Latin America & the Caribbean (IDA & IBRD countries)LatviaLeast developed countries: UN classificationLebanonLesothoLiberiaLibyaLiechtensteinLithuaniaLow & middle incomeLow incomeLower middle incomeLuxembourgMacao SAR, ChinaMacedonia, FYRMadagascarMalawiMalaysiaMaldivesMaliMaltaMarshall IslandsMauritaniaMauritiusMexicoMicronesia, Fed. Sts.Middle East & North AfricaMiddle East & North Africa (excluding high income)Middle East & North Africa (IDA & IBRD countries)Middle incomeMoldovaMonacoMongoliaMontenegroMoroccoMozambiqueMyanmarNamibiaNepalNetherlandsNew ZealandNicaraguaNigerNigeriaNorth AmericaNorwayOECD membersOmanOther small statesPacific island small statesPakistanPalauPanamaPapua New GuineaParaguayPeruPhilippinesPolandPortugalPost-demographic dividendPre-demographic dividendPuerto RicoQatarRomaniaRussian FederationRwandaSamoaSan MarinoSao Tome and PrincipeSaudi ArabiaSenegalSerbiaSeychellesSierra LeoneSingaporeSlovak RepublicSloveniaSmall statesSolomon IslandsSouth AfricaSouth AsiaSouth Asia (IDA & IBRD)SpainSri LankaSt. Kitts and NevisSt. LuciaSt. Vincent and the GrenadinesSub-Saharan Africa Sub-Saharan Africa (excluding high income)Sub-Saharan Africa (IDA & IBRD countries)SudanSurinameSwazilandSwedenSwitzerlandSyrian Arab RepublicTajikistanTanzaniaThailandTimor-LesteTogoTongaTrinidad and TobagoTunisiaTurkeyTurkmenistanTuvaluUgandaUkraineUnited Arab EmiratesUnited KingdomUnited StatesUpper middle incomeUruguayUzbekistanVanuatuVenezuela, RBVietnamWest Bank and GazaWorldYemen, Rep.ZambiaZimbabwe La ligne de temps
Cette échelle de temps montre un graphique de 1971 année à 2015 année Bolivia. Les données jusqu'à 1970 année ne sont pas présentés. Quantité d'observations actuelles selon dates: 45.
Source (désignation):
Les indicateurs du développement mondiale
Source (organisation):
World Bank staff estimates using data from the United Nations Statistics Division's National Accounts Statistics.
Catégories:
Economy & Growth, Environment
Dernière mise à jour
23 avr. 2017
Les indicateurs de changement de valeurs selon les années
Minimum:
5.119
1 janv. 1975
Maximum:
21.017
1 janv. 1984
Pour la date d''observation
Valeur
Changement absolu
Le changement par rapport à la valeur précédente
1 janv. 1971
6.06
+6.06
0.0%
1 janv. 1972
6.421
+0.36
5.95%
1 janv. 1973
6.474
+0.053
0.82%
1 janv. 1974
5.939
-0.535
-8.26%
1 janv. 1975
5.119
-0.82
-13.81%
1 janv. 1976
5.767
+0.648
12.66%
1 janv. 1977
5.934
+0.167
2.9%
1 janv. 1978
6.476
+0.542
9.13%
1 janv. 1979
6.627
+0.151
2.34%
1 janv. 1980
7.763
+1.136
17.14%
1 janv. 1981
9.503
+1.74
22.41%
1 janv. 1982
7.131
-2.372
-24.96%
1 janv. 1983
20.674
+13.543
189.92%
1 janv. 1984
21.017
+0.343
1.66%
1 janv. 1985
13.706
-7.311
-34.78%
1 janv. 1986
13.209
-0.497
-3.63%
1 janv. 1987
13.149
-0.06
-0.45%
1 janv. 1988
12.083
-1.065
-8.1%
1 janv. 1989
8.56
-3.523
-29.16%
1 janv. 1990
8.322
-0.239
-2.79%
1 janv. 1991
7.527
-0.795
-9.55%
1 janv. 1992
6.94
-0.587
-7.8%
1 janv. 1993
7.11
+0.17
2.45%
1 janv. 1994
7.24
+0.131
1.84%
1 janv. 1995
7.464
+0.223
3.08%
1 janv. 1996
7.095
-0.369
-4.94%
1 janv. 1997
6.97
-0.125
-1.76%
1 janv. 1998
6.524
-0.445
-6.39%
1 janv. 1999
5.842
-0.682
-10.45%
1 janv. 2000
7.15
+1.308
22.39%
1 janv. 2001
7.655
+0.505
7.06%
1 janv. 2002
7.004
-0.651
-8.5%
1 janv. 2003
6.408
-0.596
-8.51%
1 janv. 2004
6.718
+0.31
4.83%
1 janv. 2005
6.305
-0.413
-6.15%
1 janv. 2006
6.7
+0.395
6.26%
1 janv. 2007
7.523
+0.823
12.29%
1 janv. 2008
7.477
-0.046
-0.61%
1 janv. 2009
7.366
-0.11
-1.48%
1 janv. 2010
8.08
+0.713
9.69%
1 janv. 2011
8.404
+0.324
4.01%
1 janv. 2012
8.404
+0.0
0.0%
1 janv. 2013
8.816
+0.412
4.91%
1 janv. 2014
9.144
+0.328
3.72%
1 janv. 2015
9.348
+0.204
2.23%
Classement des pays selon les statistiques actuelles par années


Commentaires: