29
/fr/
fr
AIzaSyAYiBZKx7MnpbEhh9jyipgxe19OcubqV5w
April 1, 2024
135159
Gabon
GAB
true
2
1
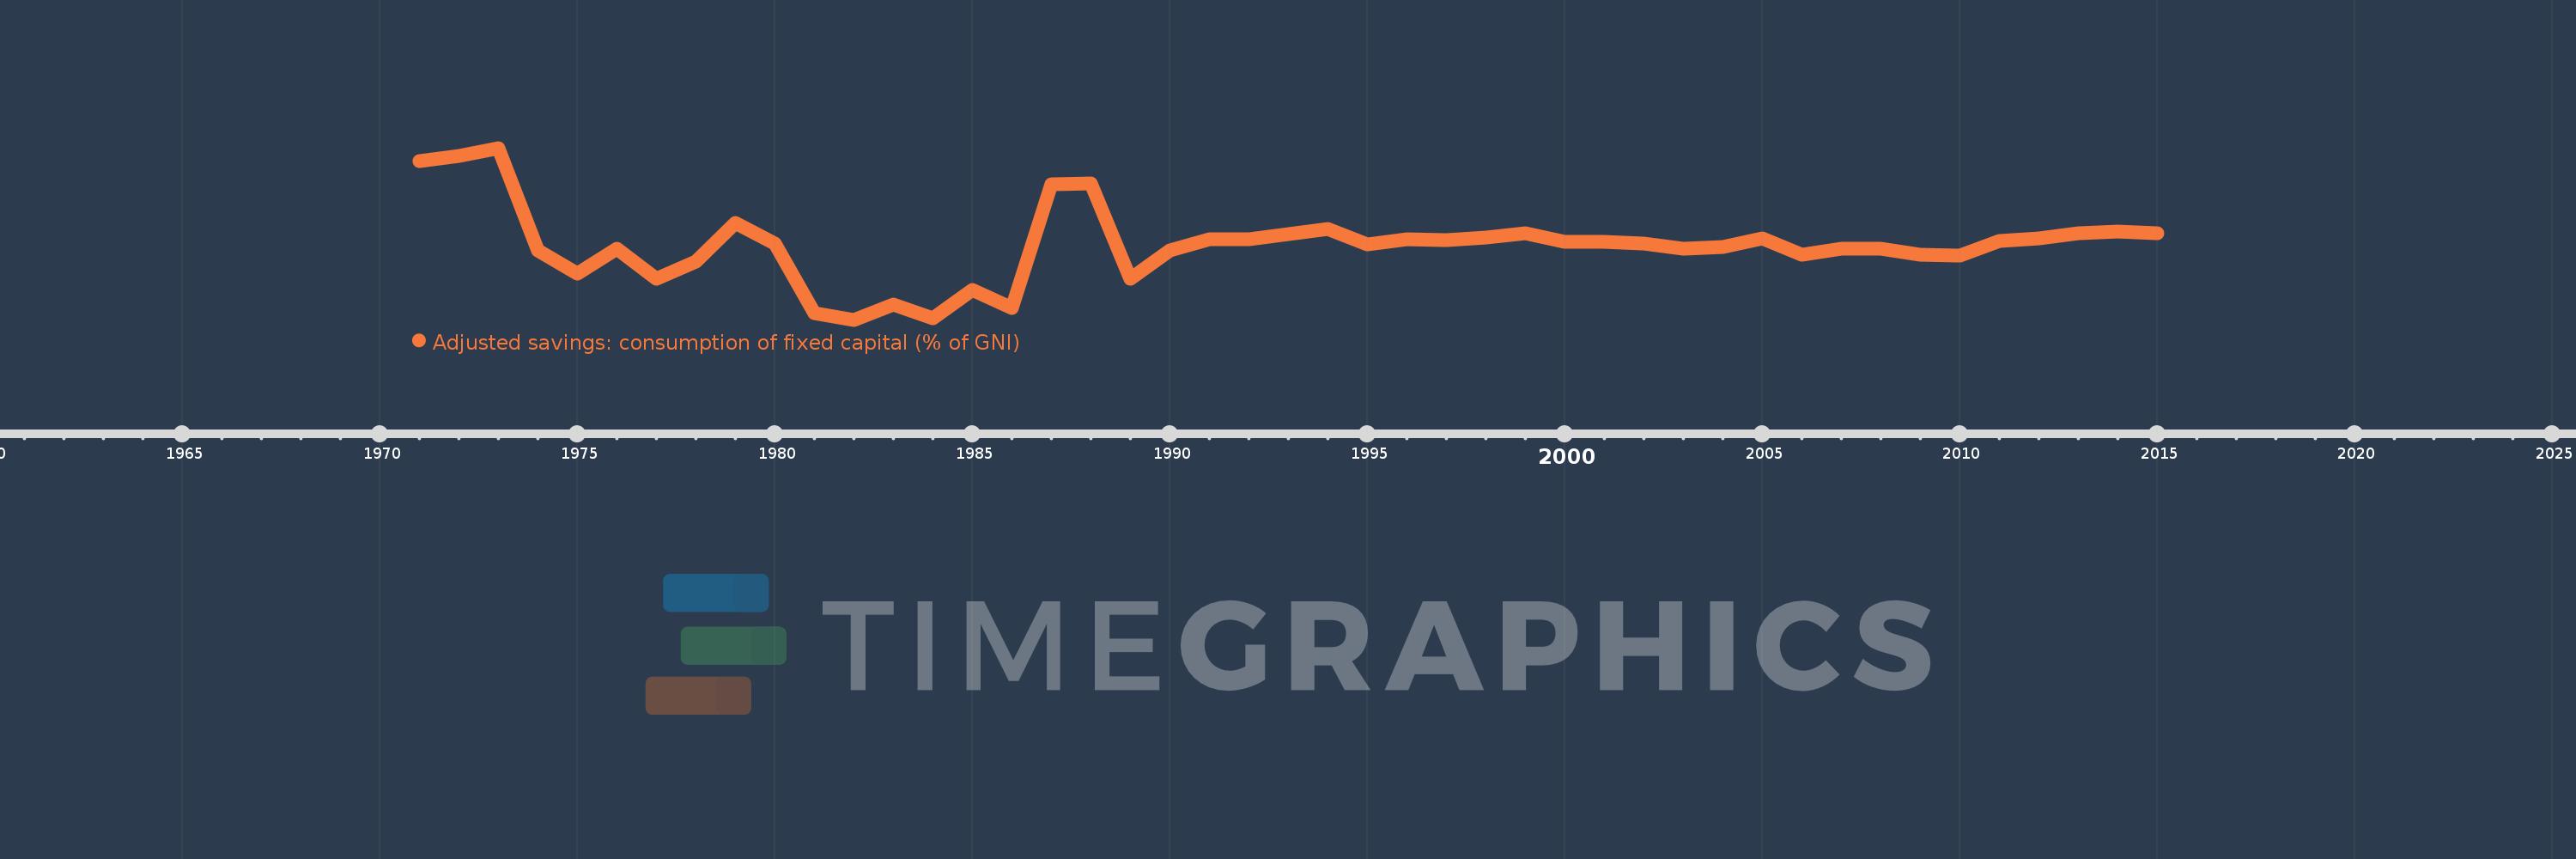
Adjusted savings: consumption of fixed capital (% of GNI)
2015,2014,2013,2012,2011,2010,2009,2008,2007,2006,2005,2004,2003,2002,2001,2000,1999,1998,1997,1996,1995,1994,1993,1992,1991,1990,1989,1988,1987,1986,1985,1984,1983,1982,1981,1980,1979,1978,1977,1976,1975,1974,1973,1972,1971
Cette statistique dans les autres pays:
AfghanistanAlbaniaAlgeriaAndorraAngolaAntigua and BarbudaArab WorldArgentinaArmeniaAustraliaAustriaAzerbaijanBahamas, TheBahrainBangladeshBarbadosBelarusBelgiumBelizeBeninBermudaBhutanBoliviaBosnia and HerzegovinaBotswanaBrazilBrunei DarussalamBulgariaBurkina FasoBurundiCabo VerdeCambodiaCameroonCanadaCaribbean small statesCentral African RepublicCentral Europe and the BalticsChadChileChinaColombiaComorosCongo, Dem. Rep.Congo, Rep.Costa RicaCote d'IvoireCroatiaCubaCyprusCzech RepublicDenmarkDjiboutiDominicaDominican RepublicEarly-demographic dividendEast Asia & PacificEast Asia & Pacific (excluding high income)East Asia & Pacific (IDA & IBRD countries)EcuadorEgypt, Arab Rep.El SalvadorEquatorial GuineaEritreaEstoniaEthiopiaEuro areaEurope & Central AsiaEurope & Central Asia (excluding high income)Europe & Central Asia (IDA & IBRD countries)European UnionFijiFinlandFragile and conflict affected situationsFranceGabonGambia, TheGeorgiaGermanyGhanaGreeceGreenlandGrenadaGuatemalaGuineaGuinea-BissauGuyanaHaitiHeavily indebted poor countries (HIPC)High incomeHondurasHong Kong SAR, ChinaHungaryIBRD onlyIcelandIDA & IBRD totalIDA blendIDA onlyIDA totalIndiaIndonesiaIran, Islamic Rep.IraqIrelandIsraelItalyJamaicaJapanJordanKazakhstanKenyaKiribatiKorea, Rep.KosovoKuwaitKyrgyz RepublicLao PDRLate-demographic dividendLatin America & Caribbean Latin America & Caribbean (excluding high income)Latin America & the Caribbean (IDA & IBRD countries)LatviaLeast developed countries: UN classificationLebanonLesothoLiberiaLibyaLiechtensteinLithuaniaLow & middle incomeLow incomeLower middle incomeLuxembourgMacao SAR, ChinaMacedonia, FYRMadagascarMalawiMalaysiaMaldivesMaliMaltaMarshall IslandsMauritaniaMauritiusMexicoMicronesia, Fed. Sts.Middle East & North AfricaMiddle East & North Africa (excluding high income)Middle East & North Africa (IDA & IBRD countries)Middle incomeMoldovaMonacoMongoliaMontenegroMoroccoMozambiqueMyanmarNamibiaNepalNetherlandsNew ZealandNicaraguaNigerNigeriaNorth AmericaNorwayOECD membersOmanOther small statesPacific island small statesPakistanPalauPanamaPapua New GuineaParaguayPeruPhilippinesPolandPortugalPost-demographic dividendPre-demographic dividendPuerto RicoQatarRomaniaRussian FederationRwandaSamoaSan MarinoSao Tome and PrincipeSaudi ArabiaSenegalSerbiaSeychellesSierra LeoneSingaporeSlovak RepublicSloveniaSmall statesSolomon IslandsSouth AfricaSouth AsiaSouth Asia (IDA & IBRD)SpainSri LankaSt. Kitts and NevisSt. LuciaSt. Vincent and the GrenadinesSub-Saharan Africa Sub-Saharan Africa (excluding high income)Sub-Saharan Africa (IDA & IBRD countries)SudanSurinameSwazilandSwedenSwitzerlandSyrian Arab RepublicTajikistanTanzaniaThailandTimor-LesteTogoTongaTrinidad and TobagoTunisiaTurkeyTurkmenistanTuvaluUgandaUkraineUnited Arab EmiratesUnited KingdomUnited StatesUpper middle incomeUruguayUzbekistanVanuatuVenezuela, RBVietnamWest Bank and GazaWorldYemen, Rep.ZambiaZimbabwe La ligne de temps
Cette échelle de temps montre un graphique de 1971 année à 2015 année Gabon. Les données jusqu'à 1970 année ne sont pas présentés. Quantité d'observations actuelles selon dates: 45.
Source (désignation):
Les indicateurs du développement mondiale
Source (organisation):
World Bank staff estimates using data from the United Nations Statistics Division's National Accounts Statistics.
Catégories:
Economy & Growth, Environment
Dernière mise à jour
23 avr. 2017
Les indicateurs de changement de valeurs selon les années
Minimum:
9.738
1 janv. 1982
Maximum:
23.592
1 janv. 1973
Pour la date d''observation
Valeur
Changement absolu
Le changement par rapport à la valeur précédente
1 janv. 1971
22.514
+22.514
0.0%
1 janv. 1972
22.917
+0.403
1.79%
1 janv. 1973
23.592
+0.676
2.95%
1 janv. 1974
15.345
-8.247
-34.96%
1 janv. 1975
13.471
-1.875
-12.22%
1 janv. 1976
15.501
+2.03
15.07%
1 janv. 1977
13.057
-2.444
-15.77%
1 janv. 1978
14.415
+1.358
10.4%
1 janv. 1979
17.513
+3.097
21.49%
1 janv. 1980
15.858
-1.655
-9.45%
1 janv. 1981
10.302
-5.556
-35.04%
1 janv. 1982
9.738
-0.564
-5.47%
1 janv. 1983
10.948
+1.21
12.42%
1 janv. 1984
9.849
-1.099
-10.04%
1 janv. 1985
12.108
+2.259
22.94%
1 janv. 1986
10.656
-1.452
-11.99%
1 janv. 1987
20.664
+10.008
93.92%
1 janv. 1988
20.752
+0.088
0.42%
1 janv. 1989
13.022
-7.729
-37.25%
1 janv. 1990
15.301
+2.279
17.5%
1 janv. 1991
16.194
+0.893
5.83%
1 janv. 1992
16.201
+0.007
0.05%
1 janv. 1993
16.666
+0.465
2.87%
1 janv. 1994
17.026
+0.36
2.16%
1 janv. 1995
15.842
-1.184
-6.95%
1 janv. 1996
16.262
+0.42
2.65%
1 janv. 1997
16.143
-0.119
-0.73%
1 janv. 1998
16.38
+0.237
1.47%
1 janv. 1999
16.734
+0.354
2.16%
1 janv. 2000
16.026
-0.708
-4.23%
1 janv. 2001
15.999
-0.028
-0.17%
1 janv. 2002
15.877
-0.122
-0.76%
1 janv. 2003
15.457
-0.42
-2.64%
1 janv. 2004
15.623
+0.166
1.07%
1 janv. 2005
16.329
+0.706
4.52%
1 janv. 2006
14.962
-1.367
-8.37%
1 janv. 2007
15.451
+0.489
3.27%
1 janv. 2008
15.489
+0.038
0.25%
1 janv. 2009
14.989
-0.5
-3.23%
1 janv. 2010
14.912
-0.077
-0.51%
1 janv. 2011
16.057
+1.145
7.68%
1 janv. 2012
16.293
+0.236
1.47%
1 janv. 2013
16.748
+0.455
2.79%
1 janv. 2014
16.851
+0.103
0.61%
1 janv. 2015
16.689
-0.162
-0.96%
Classement des pays selon les statistiques actuelles par années


Commentaires: