29
/fr/
fr
AIzaSyAYiBZKx7MnpbEhh9jyipgxe19OcubqV5w
April 1, 2024
223127
Philippines
PHL
true
2
1
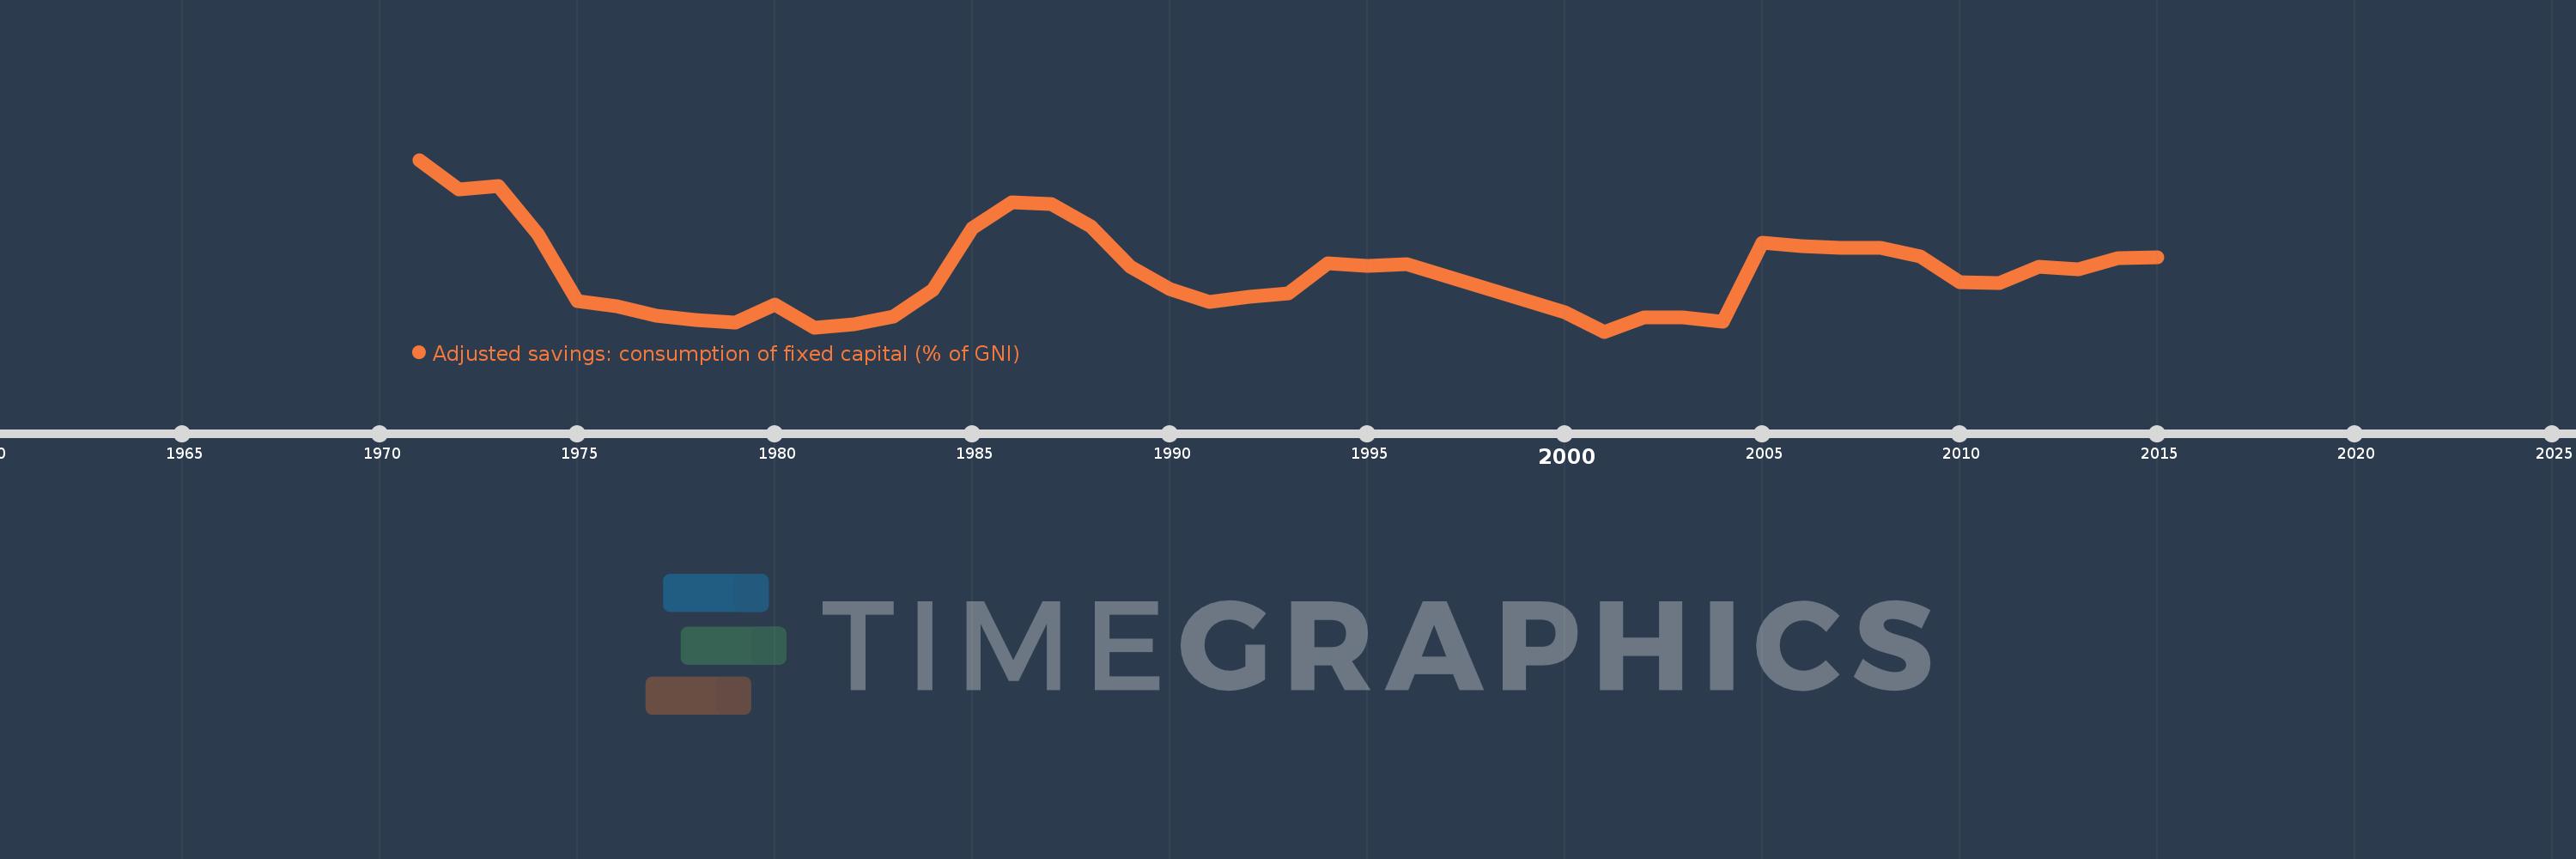
Adjusted savings: consumption of fixed capital (% of GNI)
2015,2014,2013,2012,2011,2010,2009,2008,2007,2006,2005,2004,2003,2002,2001,2000,1999,1998,1997,1996,1995,1994,1993,1992,1991,1990,1989,1988,1987,1986,1985,1984,1983,1982,1981,1980,1979,1978,1977,1976,1975,1974,1973,1972,1971
Cette statistique dans les autres pays:
AfghanistanAlbaniaAlgeriaAndorraAngolaAntigua and BarbudaArab WorldArgentinaArmeniaAustraliaAustriaAzerbaijanBahamas, TheBahrainBangladeshBarbadosBelarusBelgiumBelizeBeninBermudaBhutanBoliviaBosnia and HerzegovinaBotswanaBrazilBrunei DarussalamBulgariaBurkina FasoBurundiCabo VerdeCambodiaCameroonCanadaCaribbean small statesCentral African RepublicCentral Europe and the BalticsChadChileChinaColombiaComorosCongo, Dem. Rep.Congo, Rep.Costa RicaCote d'IvoireCroatiaCubaCyprusCzech RepublicDenmarkDjiboutiDominicaDominican RepublicEarly-demographic dividendEast Asia & PacificEast Asia & Pacific (excluding high income)East Asia & Pacific (IDA & IBRD countries)EcuadorEgypt, Arab Rep.El SalvadorEquatorial GuineaEritreaEstoniaEthiopiaEuro areaEurope & Central AsiaEurope & Central Asia (excluding high income)Europe & Central Asia (IDA & IBRD countries)European UnionFijiFinlandFragile and conflict affected situationsFranceGabonGambia, TheGeorgiaGermanyGhanaGreeceGreenlandGrenadaGuatemalaGuineaGuinea-BissauGuyanaHaitiHeavily indebted poor countries (HIPC)High incomeHondurasHong Kong SAR, ChinaHungaryIBRD onlyIcelandIDA & IBRD totalIDA blendIDA onlyIDA totalIndiaIndonesiaIran, Islamic Rep.IraqIrelandIsraelItalyJamaicaJapanJordanKazakhstanKenyaKiribatiKorea, Rep.KosovoKuwaitKyrgyz RepublicLao PDRLate-demographic dividendLatin America & Caribbean Latin America & Caribbean (excluding high income)Latin America & the Caribbean (IDA & IBRD countries)LatviaLeast developed countries: UN classificationLebanonLesothoLiberiaLibyaLiechtensteinLithuaniaLow & middle incomeLow incomeLower middle incomeLuxembourgMacao SAR, ChinaMacedonia, FYRMadagascarMalawiMalaysiaMaldivesMaliMaltaMarshall IslandsMauritaniaMauritiusMexicoMicronesia, Fed. Sts.Middle East & North AfricaMiddle East & North Africa (excluding high income)Middle East & North Africa (IDA & IBRD countries)Middle incomeMoldovaMonacoMongoliaMontenegroMoroccoMozambiqueMyanmarNamibiaNepalNetherlandsNew ZealandNicaraguaNigerNigeriaNorth AmericaNorwayOECD membersOmanOther small statesPacific island small statesPakistanPalauPanamaPapua New GuineaParaguayPeruPhilippinesPolandPortugalPost-demographic dividendPre-demographic dividendPuerto RicoQatarRomaniaRussian FederationRwandaSamoaSan MarinoSao Tome and PrincipeSaudi ArabiaSenegalSerbiaSeychellesSierra LeoneSingaporeSlovak RepublicSloveniaSmall statesSolomon IslandsSouth AfricaSouth AsiaSouth Asia (IDA & IBRD)SpainSri LankaSt. Kitts and NevisSt. LuciaSt. Vincent and the GrenadinesSub-Saharan Africa Sub-Saharan Africa (excluding high income)Sub-Saharan Africa (IDA & IBRD countries)SudanSurinameSwazilandSwedenSwitzerlandSyrian Arab RepublicTajikistanTanzaniaThailandTimor-LesteTogoTongaTrinidad and TobagoTunisiaTurkeyTurkmenistanTuvaluUgandaUkraineUnited Arab EmiratesUnited KingdomUnited StatesUpper middle incomeUruguayUzbekistanVanuatuVenezuela, RBVietnamWest Bank and GazaWorldYemen, Rep.ZambiaZimbabwe La ligne de temps
Cette échelle de temps montre un graphique de 1971 année à 2015 année Philippines. Les données jusqu'à 1970 année ne sont pas présentés. Quantité d'observations actuelles selon dates: 45.
Source (désignation):
Les indicateurs du développement mondiale
Source (organisation):
World Bank staff estimates using data from the United Nations Statistics Division's National Accounts Statistics.
Catégories:
Economy & Growth, Environment
Dernière mise à jour
23 avr. 2017
Les indicateurs de changement de valeurs selon les années
Minimum:
7.004
1 janv. 2001
Maximum:
11.449
1 janv. 1971
Pour la date d''observation
Valeur
Changement absolu
Le changement par rapport à la valeur précédente
1 janv. 1971
11.449
+11.449
0.0%
1 janv. 1972
10.674
-0.775
-6.77%
1 janv. 1973
10.776
+0.101
0.95%
1 janv. 1974
9.531
-1.245
-11.55%
1 janv. 1975
7.792
-1.739
-18.24%
1 janv. 1976
7.668
-0.124
-1.59%
1 janv. 1977
7.424
-0.244
-3.19%
1 janv. 1978
7.299
-0.126
-1.69%
1 janv. 1979
7.245
-0.053
-0.73%
1 janv. 1980
7.699
+0.454
6.27%
1 janv. 1981
7.11
-0.59
-7.66%
1 janv. 1982
7.198
+0.088
1.24%
1 janv. 1983
7.382
+0.184
2.56%
1 janv. 1984
8.09
+0.708
9.59%
1 janv. 1985
9.687
+1.597
19.74%
1 janv. 1986
10.352
+0.665
6.87%
1 janv. 1987
10.311
-0.041
-0.39%
1 janv. 1988
9.723
-0.588
-5.7%
1 janv. 1989
8.684
-1.04
-10.69%
1 janv. 1990
8.108
-0.575
-6.62%
1 janv. 1991
7.765
-0.343
-4.23%
1 janv. 1992
7.908
+0.143
1.84%
1 janv. 1993
7.983
+0.074
0.94%
1 janv. 1994
8.774
+0.792
9.92%
1 janv. 1995
8.7
-0.074
-0.85%
1 janv. 1996
8.749
+0.049
0.56%
1 janv. 1997
8.434
-0.315
-3.6%
1 janv. 1998
8.116
-0.318
-3.77%
1 janv. 1999
7.821
-0.295
-3.64%
1 janv. 2000
7.502
-0.318
-4.07%
1 janv. 2001
7.004
-0.498
-6.64%
1 janv. 2002
7.36
+0.355
5.07%
1 janv. 2003
7.38
+0.02
0.28%
1 janv. 2004
7.263
-0.117
-1.58%
1 janv. 2005
9.301
+2.038
28.06%
1 janv. 2006
9.218
-0.083
-0.9%
1 janv. 2007
9.176
-0.042
-0.46%
1 janv. 2008
9.169
-0.007
-0.07%
1 janv. 2009
8.946
-0.224
-2.44%
1 janv. 2010
8.288
-0.658
-7.35%
1 janv. 2011
8.256
-0.032
-0.39%
1 janv. 2012
8.681
+0.425
5.15%
1 janv. 2013
8.613
-0.068
-0.79%
1 janv. 2014
8.908
+0.296
3.43%
1 janv. 2015
8.919
+0.011
0.12%
Classement des pays selon les statistiques actuelles par années


Commentaires: