29
/fr/
fr
AIzaSyAYiBZKx7MnpbEhh9jyipgxe19OcubqV5w
April 1, 2024
23866
Arab World
ARB
false
2
1
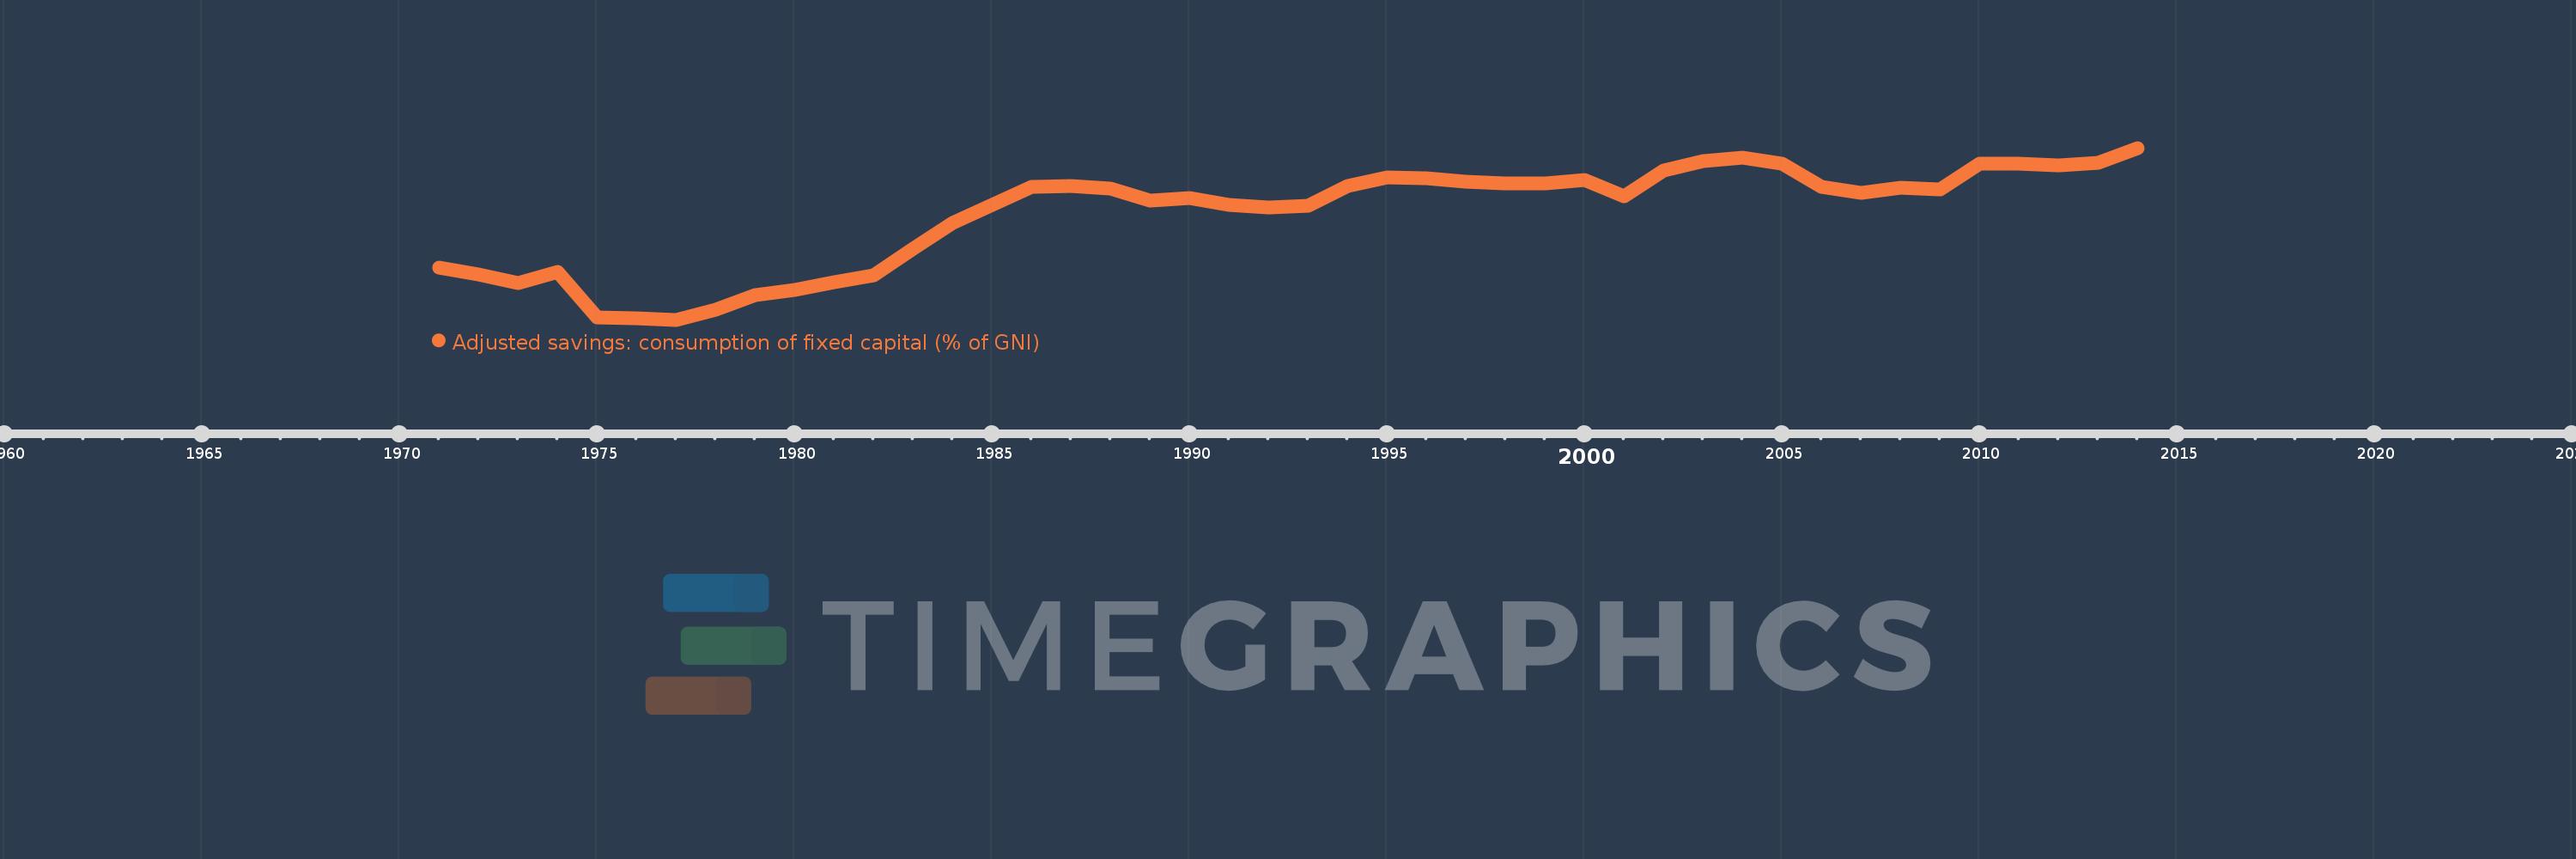
Adjusted savings: consumption of fixed capital (% of GNI)
2014,2013,2012,2011,2010,2009,2008,2007,2006,2005,2004,2003,2002,2001,2000,1999,1998,1997,1996,1995,1994,1993,1992,1991,1990,1989,1988,1987,1986,1985,1984,1983,1982,1981,1980,1979,1978,1977,1976,1975,1974,1973,1972,1971
Cette statistique dans les autres pays:
AfghanistanAlbaniaAlgeriaAndorraAngolaAntigua and BarbudaArab WorldArgentinaArmeniaAustraliaAustriaAzerbaijanBahamas, TheBahrainBangladeshBarbadosBelarusBelgiumBelizeBeninBermudaBhutanBoliviaBosnia and HerzegovinaBotswanaBrazilBrunei DarussalamBulgariaBurkina FasoBurundiCabo VerdeCambodiaCameroonCanadaCaribbean small statesCentral African RepublicCentral Europe and the BalticsChadChileChinaColombiaComorosCongo, Dem. Rep.Congo, Rep.Costa RicaCote d'IvoireCroatiaCubaCyprusCzech RepublicDenmarkDjiboutiDominicaDominican RepublicEarly-demographic dividendEast Asia & PacificEast Asia & Pacific (excluding high income)East Asia & Pacific (IDA & IBRD countries)EcuadorEgypt, Arab Rep.El SalvadorEquatorial GuineaEritreaEstoniaEthiopiaEuro areaEurope & Central AsiaEurope & Central Asia (excluding high income)Europe & Central Asia (IDA & IBRD countries)European UnionFijiFinlandFragile and conflict affected situationsFranceGabonGambia, TheGeorgiaGermanyGhanaGreeceGreenlandGrenadaGuatemalaGuineaGuinea-BissauGuyanaHaitiHeavily indebted poor countries (HIPC)High incomeHondurasHong Kong SAR, ChinaHungaryIBRD onlyIcelandIDA & IBRD totalIDA blendIDA onlyIDA totalIndiaIndonesiaIran, Islamic Rep.IraqIrelandIsraelItalyJamaicaJapanJordanKazakhstanKenyaKiribatiKorea, Rep.KosovoKuwaitKyrgyz RepublicLao PDRLate-demographic dividendLatin America & Caribbean Latin America & Caribbean (excluding high income)Latin America & the Caribbean (IDA & IBRD countries)LatviaLeast developed countries: UN classificationLebanonLesothoLiberiaLibyaLiechtensteinLithuaniaLow & middle incomeLow incomeLower middle incomeLuxembourgMacao SAR, ChinaMacedonia, FYRMadagascarMalawiMalaysiaMaldivesMaliMaltaMarshall IslandsMauritaniaMauritiusMexicoMicronesia, Fed. Sts.Middle East & North AfricaMiddle East & North Africa (excluding high income)Middle East & North Africa (IDA & IBRD countries)Middle incomeMoldovaMonacoMongoliaMontenegroMoroccoMozambiqueMyanmarNamibiaNepalNetherlandsNew ZealandNicaraguaNigerNigeriaNorth AmericaNorwayOECD membersOmanOther small statesPacific island small statesPakistanPalauPanamaPapua New GuineaParaguayPeruPhilippinesPolandPortugalPost-demographic dividendPre-demographic dividendPuerto RicoQatarRomaniaRussian FederationRwandaSamoaSan MarinoSao Tome and PrincipeSaudi ArabiaSenegalSerbiaSeychellesSierra LeoneSingaporeSlovak RepublicSloveniaSmall statesSolomon IslandsSouth AfricaSouth AsiaSouth Asia (IDA & IBRD)SpainSri LankaSt. Kitts and NevisSt. LuciaSt. Vincent and the GrenadinesSub-Saharan Africa Sub-Saharan Africa (excluding high income)Sub-Saharan Africa (IDA & IBRD countries)SudanSurinameSwazilandSwedenSwitzerlandSyrian Arab RepublicTajikistanTanzaniaThailandTimor-LesteTogoTongaTrinidad and TobagoTunisiaTurkeyTurkmenistanTuvaluUgandaUkraineUnited Arab EmiratesUnited KingdomUnited StatesUpper middle incomeUruguayUzbekistanVanuatuVenezuela, RBVietnamWest Bank and GazaWorldYemen, Rep.ZambiaZimbabwe La ligne de temps
Cette échelle de temps montre un graphique de 1971 année à 2014 année Arab World. Les données jusqu'à 1970 année ne sont pas présentés. Quantité d'observations actuelles selon dates: 44.
Source (désignation):
Les indicateurs du développement mondiale
Source (organisation):
World Bank staff estimates using data from the United Nations Statistics Division's National Accounts Statistics.
Catégories:
Economy & Growth, Environment
Dernière mise à jour
23 avr. 2017
Les indicateurs de changement de valeurs selon les années
Maximum:
10.165
1 janv. 2014
Pour la date d''observation
Valeur
Changement absolu
Le changement par rapport à la valeur précédente
1 janv. 1971
6.444
+6.444
0.0%
1 janv. 1972
6.247
-0.197
-3.06%
1 janv. 1973
5.981
-0.265
-4.25%
1 janv. 1974
6.321
+0.34
5.68%
1 janv. 1975
4.904
-1.417
-22.41%
1 janv. 1976
4.891
-0.013
-0.26%
1 janv. 1977
4.84
-0.051
-1.05%
1 janv. 1978
5.144
+0.305
6.29%
1 janv. 1979
5.607
+0.463
8.99%
1 janv. 1980
5.76
+0.153
2.73%
1 janv. 1981
6.01
+0.25
4.33%
1 janv. 1982
6.229
+0.219
3.65%
1 janv. 1983
7.055
+0.826
13.27%
1 janv. 1984
7.843
+0.787
11.16%
1 janv. 1985
8.387
+0.545
6.95%
1 janv. 1986
8.965
+0.577
6.88%
1 janv. 1987
8.995
+0.03
0.34%
1 janv. 1988
8.895
-0.1
-1.11%
1 janv. 1989
8.54
-0.355
-3.99%
1 janv. 1990
8.613
+0.072
0.84%
1 janv. 1991
8.391
-0.222
-2.57%
1 janv. 1992
8.333
-0.058
-0.69%
1 janv. 1993
8.383
+0.049
0.59%
1 janv. 1994
8.994
+0.612
7.3%
1 janv. 1995
9.262
+0.268
2.98%
1 janv. 1996
9.223
-0.04
-0.43%
1 janv. 1997
9.129
-0.093
-1.01%
1 janv. 1998
9.062
-0.068
-0.74%
1 janv. 1999
9.071
+0.01
0.11%
1 janv. 2000
9.174
+0.103
1.14%
1 janv. 2001
8.665
-0.509
-5.55%
1 janv. 2002
9.461
+0.796
9.18%
1 janv. 2003
9.757
+0.296
3.13%
1 janv. 2004
9.853
+0.096
0.99%
1 janv. 2005
9.673
-0.181
-1.83%
1 janv. 2006
8.967
-0.706
-7.3%
1 janv. 2007
8.777
-0.19
-2.12%
1 janv. 2008
8.938
+0.161
1.84%
1 janv. 2009
8.885
-0.053
-0.59%
1 janv. 2010
9.683
+0.798
8.98%
1 janv. 2011
9.665
-0.017
-0.18%
1 janv. 2012
9.621
-0.044
-0.46%
1 janv. 2013
9.703
+0.082
0.85%
1 janv. 2014
10.165
+0.461
4.76%
Classement des pays selon les statistiques actuelles par années


Commentaires: