29
/fr/
fr
AIzaSyAYiBZKx7MnpbEhh9jyipgxe19OcubqV5w
April 1, 2024
44787
Low & middle income
LMY
false
2
1
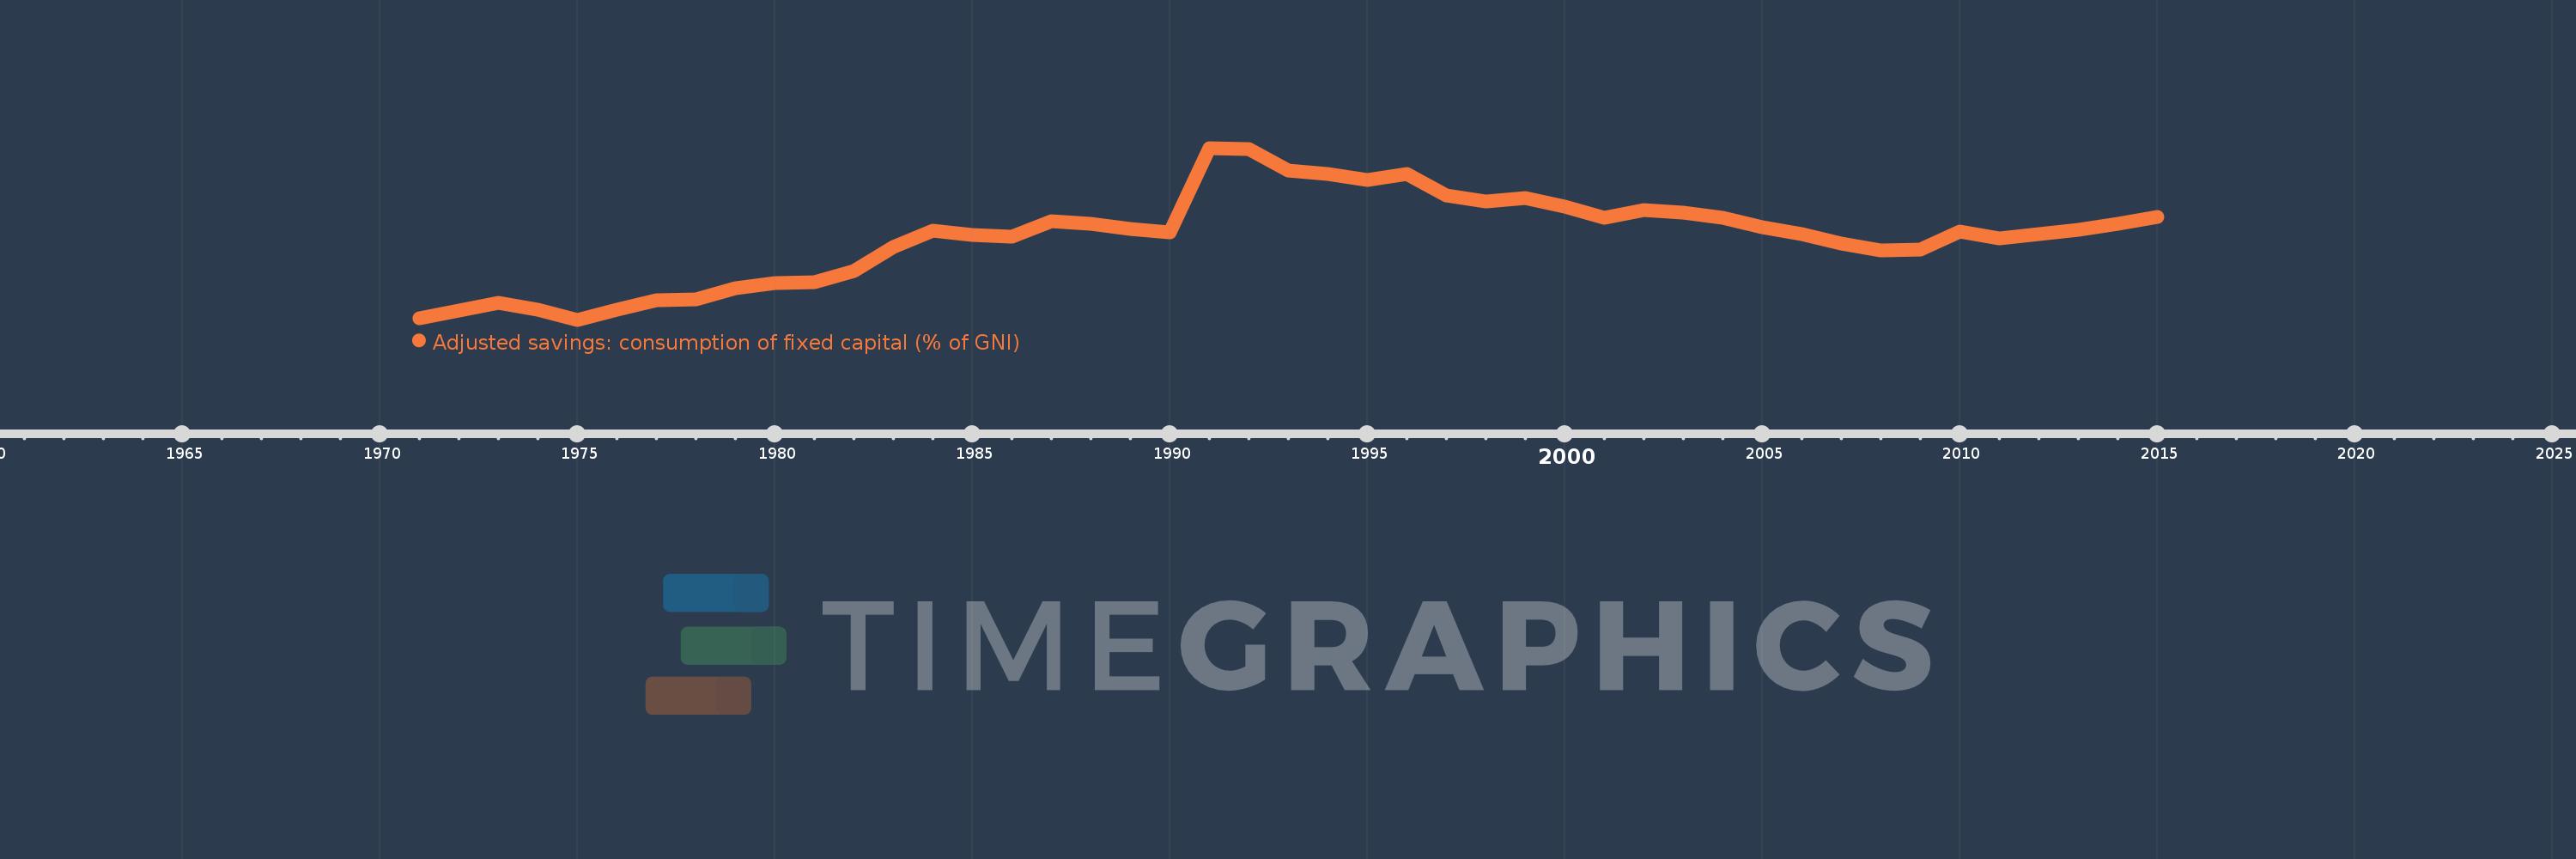
Adjusted savings: consumption of fixed capital (% of GNI)
2015,2014,2013,2012,2011,2010,2009,2008,2007,2006,2005,2004,2003,2002,2001,2000,1999,1998,1997,1996,1995,1994,1993,1992,1991,1990,1989,1988,1987,1986,1985,1984,1983,1982,1981,1980,1979,1978,1977,1976,1975,1974,1973,1972,1971
Cette statistique dans les autres pays:
AfghanistanAlbaniaAlgeriaAndorraAngolaAntigua and BarbudaArab WorldArgentinaArmeniaAustraliaAustriaAzerbaijanBahamas, TheBahrainBangladeshBarbadosBelarusBelgiumBelizeBeninBermudaBhutanBoliviaBosnia and HerzegovinaBotswanaBrazilBrunei DarussalamBulgariaBurkina FasoBurundiCabo VerdeCambodiaCameroonCanadaCaribbean small statesCentral African RepublicCentral Europe and the BalticsChadChileChinaColombiaComorosCongo, Dem. Rep.Congo, Rep.Costa RicaCote d'IvoireCroatiaCubaCyprusCzech RepublicDenmarkDjiboutiDominicaDominican RepublicEarly-demographic dividendEast Asia & PacificEast Asia & Pacific (excluding high income)East Asia & Pacific (IDA & IBRD countries)EcuadorEgypt, Arab Rep.El SalvadorEquatorial GuineaEritreaEstoniaEthiopiaEuro areaEurope & Central AsiaEurope & Central Asia (excluding high income)Europe & Central Asia (IDA & IBRD countries)European UnionFijiFinlandFragile and conflict affected situationsFranceGabonGambia, TheGeorgiaGermanyGhanaGreeceGreenlandGrenadaGuatemalaGuineaGuinea-BissauGuyanaHaitiHeavily indebted poor countries (HIPC)High incomeHondurasHong Kong SAR, ChinaHungaryIBRD onlyIcelandIDA & IBRD totalIDA blendIDA onlyIDA totalIndiaIndonesiaIran, Islamic Rep.IraqIrelandIsraelItalyJamaicaJapanJordanKazakhstanKenyaKiribatiKorea, Rep.KosovoKuwaitKyrgyz RepublicLao PDRLate-demographic dividendLatin America & Caribbean Latin America & Caribbean (excluding high income)Latin America & the Caribbean (IDA & IBRD countries)LatviaLeast developed countries: UN classificationLebanonLesothoLiberiaLibyaLiechtensteinLithuaniaLow & middle incomeLow incomeLower middle incomeLuxembourgMacao SAR, ChinaMacedonia, FYRMadagascarMalawiMalaysiaMaldivesMaliMaltaMarshall IslandsMauritaniaMauritiusMexicoMicronesia, Fed. Sts.Middle East & North AfricaMiddle East & North Africa (excluding high income)Middle East & North Africa (IDA & IBRD countries)Middle incomeMoldovaMonacoMongoliaMontenegroMoroccoMozambiqueMyanmarNamibiaNepalNetherlandsNew ZealandNicaraguaNigerNigeriaNorth AmericaNorwayOECD membersOmanOther small statesPacific island small statesPakistanPalauPanamaPapua New GuineaParaguayPeruPhilippinesPolandPortugalPost-demographic dividendPre-demographic dividendPuerto RicoQatarRomaniaRussian FederationRwandaSamoaSan MarinoSao Tome and PrincipeSaudi ArabiaSenegalSerbiaSeychellesSierra LeoneSingaporeSlovak RepublicSloveniaSmall statesSolomon IslandsSouth AfricaSouth AsiaSouth Asia (IDA & IBRD)SpainSri LankaSt. Kitts and NevisSt. LuciaSt. Vincent and the GrenadinesSub-Saharan Africa Sub-Saharan Africa (excluding high income)Sub-Saharan Africa (IDA & IBRD countries)SudanSurinameSwazilandSwedenSwitzerlandSyrian Arab RepublicTajikistanTanzaniaThailandTimor-LesteTogoTongaTrinidad and TobagoTunisiaTurkeyTurkmenistanTuvaluUgandaUkraineUnited Arab EmiratesUnited KingdomUnited StatesUpper middle incomeUruguayUzbekistanVanuatuVenezuela, RBVietnamWest Bank and GazaWorldYemen, Rep.ZambiaZimbabwe La ligne de temps
Cette échelle de temps montre un graphique de 1971 année à 2015 année Low & middle income. Les données jusqu'à 1970 année ne sont pas présentés. Quantité d'observations actuelles selon dates: 45.
Source (désignation):
Les indicateurs du développement mondiale
Source (organisation):
World Bank staff estimates using data from the United Nations Statistics Division's National Accounts Statistics.
Catégories:
Economy & Growth, Environment
Dernière mise à jour
23 avr. 2017
Les indicateurs de changement de valeurs selon les années
Minimum:
7.858
1 janv. 1975
Maximum:
12.628
1 janv. 1991
Pour la date d''observation
Valeur
Changement absolu
Le changement par rapport à la valeur précédente
1 janv. 1971
7.901
+7.901
0.0%
1 janv. 1972
8.109
+0.208
2.63%
1 janv. 1973
8.317
+0.208
2.56%
1 janv. 1974
8.138
-0.179
-2.15%
1 janv. 1975
7.858
-0.28
-3.44%
1 janv. 1976
8.141
+0.283
3.6%
1 janv. 1977
8.392
+0.251
3.08%
1 janv. 1978
8.417
+0.025
0.29%
1 janv. 1979
8.744
+0.327
3.89%
1 janv. 1980
8.866
+0.122
1.4%
1 janv. 1981
8.907
+0.041
0.46%
1 janv. 1982
9.199
+0.292
3.28%
1 janv. 1983
9.873
+0.674
7.33%
1 janv. 1984
10.322
+0.449
4.55%
1 janv. 1985
10.207
-0.116
-1.12%
1 janv. 1986
10.172
-0.035
-0.34%
1 janv. 1987
10.592
+0.42
4.13%
1 janv. 1988
10.516
-0.077
-0.72%
1 janv. 1989
10.368
-0.148
-1.41%
1 janv. 1990
10.289
-0.079
-0.76%
1 janv. 1991
12.628
+2.339
22.73%
1 janv. 1992
12.589
-0.039
-0.31%
1 janv. 1993
12.003
-0.586
-4.66%
1 janv. 1994
11.915
-0.088
-0.73%
1 janv. 1995
11.748
-0.167
-1.4%
1 janv. 1996
11.913
+0.165
1.41%
1 janv. 1997
11.32
-0.594
-4.98%
1 janv. 1998
11.136
-0.183
-1.62%
1 janv. 1999
11.241
+0.104
0.93%
1 janv. 2000
11.008
-0.233
-2.07%
1 janv. 2001
10.689
-0.319
-2.89%
1 janv. 2002
10.915
+0.226
2.12%
1 janv. 2003
10.843
-0.072
-0.66%
1 janv. 2004
10.69
-0.153
-1.41%
1 janv. 2005
10.415
-0.276
-2.58%
1 janv. 2006
10.239
-0.176
-1.69%
1 janv. 2007
9.973
-0.266
-2.6%
1 janv. 2008
9.792
-0.181
-1.81%
1 janv. 2009
9.808
+0.016
0.17%
1 janv. 2010
10.303
+0.495
5.04%
1 janv. 2011
10.108
-0.195
-1.89%
1 janv. 2012
10.243
+0.135
1.33%
1 janv. 2013
10.367
+0.125
1.22%
1 janv. 2014
10.522
+0.155
1.49%
1 janv. 2015
10.719
+0.197
1.87%
Classement des pays selon les statistiques actuelles par années


Commentaires: