29
/fr/
fr
AIzaSyAYiBZKx7MnpbEhh9jyipgxe19OcubqV5w
April 1, 2024
84687
Benin
BEN
true
2
1
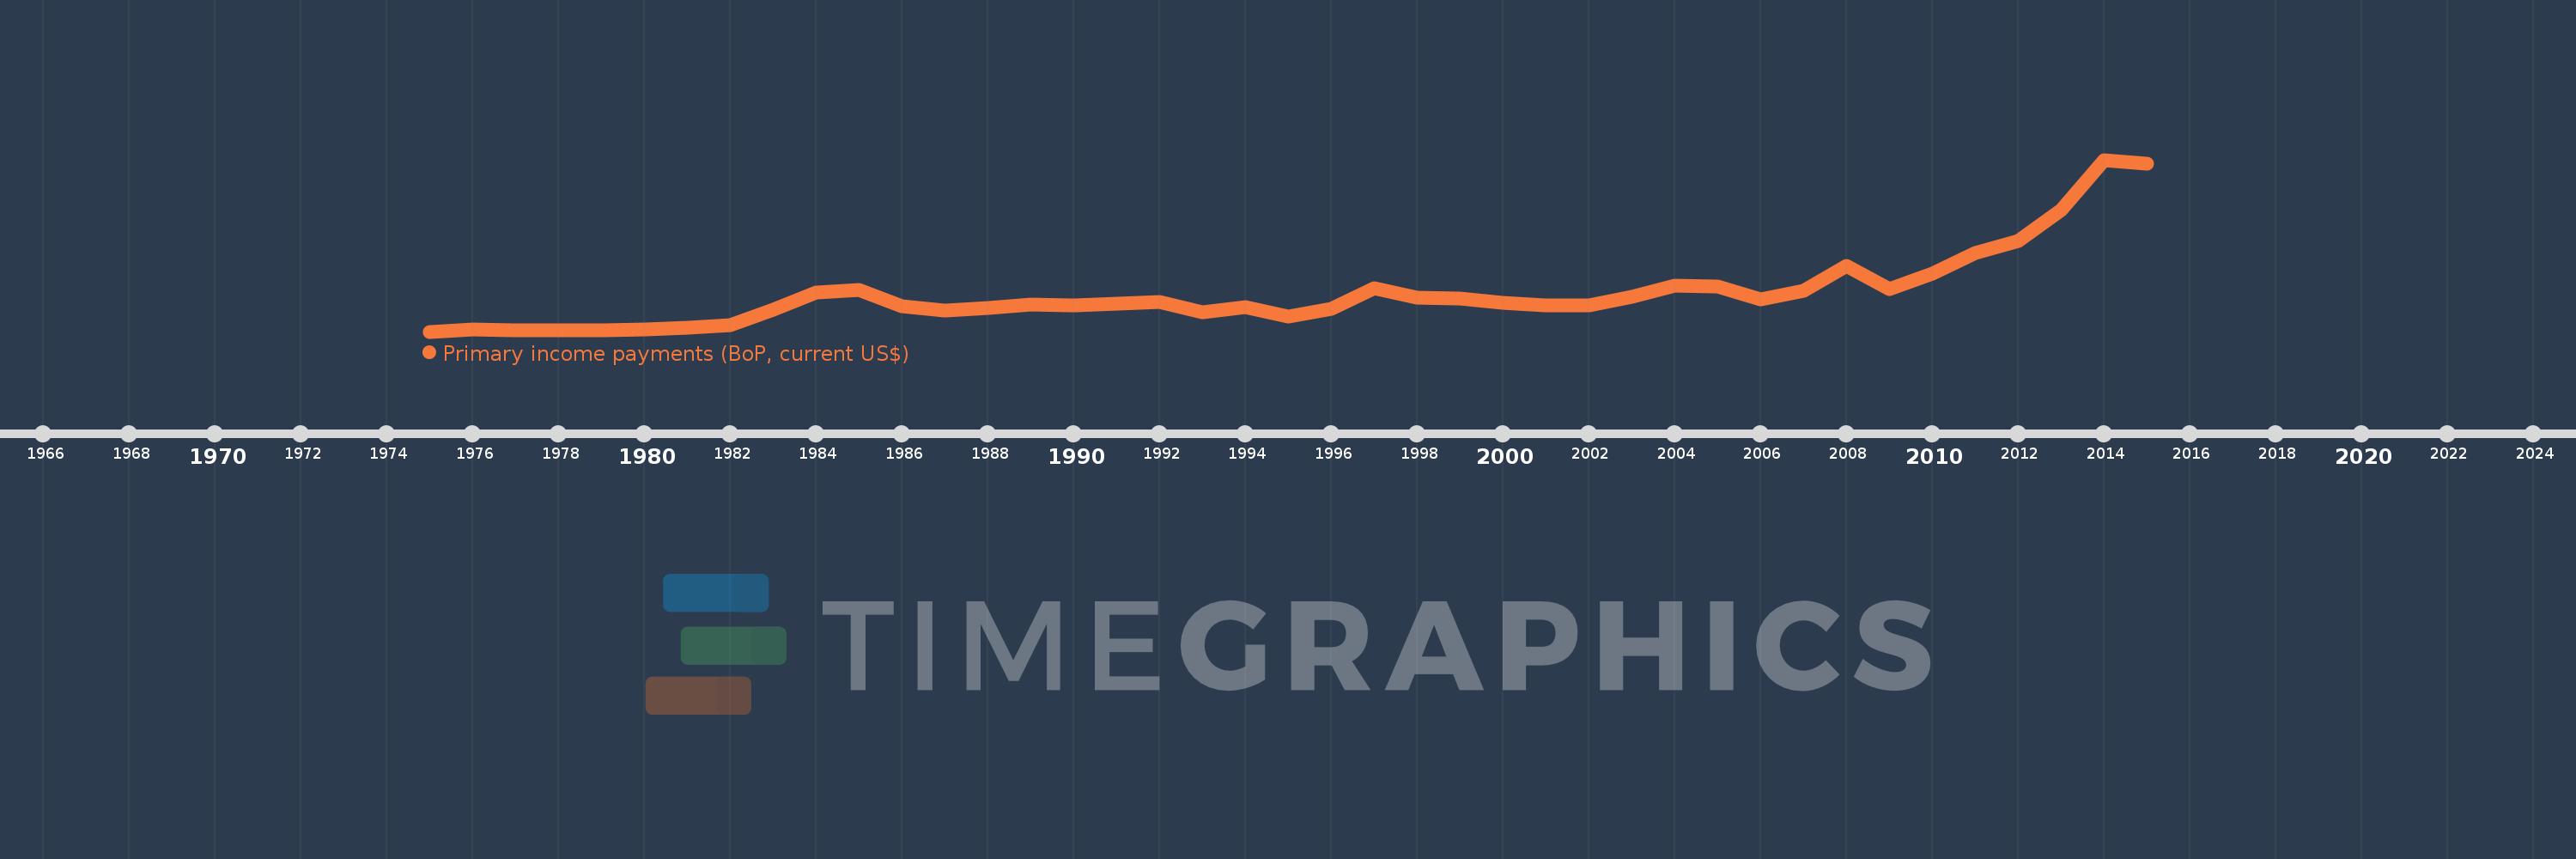
Primary income payments (BoP, current US$)
2015,2014,2013,2012,2011,2010,2009,2008,2007,2006,2005,2004,2003,2002,2001,2000,1999,1998,1997,1996,1995,1994,1993,1992,1991,1990,1989,1988,1987,1986,1985,1984,1983,1982,1981,1980,1979,1978,1977,1976,1975
Cette statistique dans les autres pays:
AfghanistanAlbaniaAlgeriaAngolaAntigua and BarbudaArab WorldArgentinaArmeniaArubaAustraliaAustriaAzerbaijanBahamas, TheBahrainBangladeshBarbadosBelarusBelgiumBelizeBeninBermudaBhutanBoliviaBosnia and HerzegovinaBotswanaBrazilBrunei DarussalamBulgariaBurkina FasoBurundiCabo VerdeCambodiaCameroonCanadaCaribbean small statesCentral African RepublicCentral Europe and the BalticsChadChileChinaColombiaComorosCongo, Dem. Rep.Congo, Rep.Costa RicaCote d'IvoireCroatiaCuracaoCyprusCzech RepublicDenmarkDjiboutiDominicaDominican RepublicEarly-demographic dividendEast Asia & PacificEast Asia & Pacific (excluding high income)East Asia & Pacific (IDA & IBRD countries)EcuadorEgypt, Arab Rep.El SalvadorEquatorial GuineaEritreaEstoniaEthiopiaEuro areaEurope & Central AsiaEurope & Central Asia (excluding high income)Europe & Central Asia (IDA & IBRD countries)European UnionFaroe IslandsFijiFinlandFragile and conflict affected situationsFranceFrench PolynesiaGabonGambia, TheGeorgiaGermanyGhanaGreeceGrenadaGuatemalaGuineaGuinea-BissauGuyanaHaitiHeavily indebted poor countries (HIPC)High incomeHondurasHong Kong SAR, ChinaHungaryIBRD onlyIcelandIDA & IBRD totalIDA blendIDA onlyIDA totalIndiaIndonesiaIran, Islamic Rep.IraqIrelandIsraelItalyJamaicaJapanJordanKazakhstanKenyaKiribatiKorea, Rep.KosovoKuwaitKyrgyz RepublicLao PDRLate-demographic dividendLatin America & Caribbean Latin America & Caribbean (excluding high income)Latin America & the Caribbean (IDA & IBRD countries)LatviaLeast developed countries: UN classificationLebanonLesothoLiberiaLibyaLithuaniaLow & middle incomeLow incomeLower middle incomeLuxembourgMacao SAR, ChinaMacedonia, FYRMadagascarMalawiMalaysiaMaldivesMaliMaltaMarshall IslandsMauritaniaMauritiusMexicoMicronesia, Fed. Sts.Middle East & North AfricaMiddle East & North Africa (excluding high income)Middle East & North Africa (IDA & IBRD countries)Middle incomeMoldovaMongoliaMontenegroMoroccoMozambiqueMyanmarNamibiaNepalNetherlandsNew CaledoniaNew ZealandNicaraguaNigerNigeriaNorth AmericaNorwayOECD membersOmanOther small statesPacific island small statesPakistanPalauPanamaPapua New GuineaParaguayPeruPhilippinesPolandPortugalPost-demographic dividendPre-demographic dividendQatarRomaniaRussian FederationRwandaSamoaSao Tome and PrincipeSaudi ArabiaSenegalSerbiaSeychellesSierra LeoneSingaporeSint Maarten (Dutch part)Slovak RepublicSloveniaSmall statesSolomon IslandsSouth AfricaSouth AsiaSouth Asia (IDA & IBRD)South SudanSpainSri LankaSt. Kitts and NevisSt. LuciaSt. Vincent and the GrenadinesSub-Saharan Africa Sub-Saharan Africa (excluding high income)Sub-Saharan Africa (IDA & IBRD countries)SudanSurinameSwazilandSwedenSwitzerlandSyrian Arab RepublicTajikistanTanzaniaThailandTimor-LesteTogoTongaTrinidad and TobagoTunisiaTurkeyTuvaluUgandaUkraineUnited KingdomUnited StatesUpper middle incomeUruguayVanuatuVenezuela, RBVietnamWest Bank and GazaWorldYemen, Rep.ZambiaZimbabwe La ligne de temps
Cette échelle de temps montre un graphique de 1975 année à 2015 année Benin. Les données jusqu'à 1974 année ne sont pas présentés. Quantité d'observations actuelles selon dates: 41.
Source (désignation):
Les indicateurs du développement mondiale
Source (organisation):
International Monetary Fund, Balance of Payments Statistics Yearbook and data files.
Catégories:
Economy & Growth
Dernière mise à jour
23 avr. 2017
Les indicateurs de changement de valeurs selon les années
Minimum:
1.786 mln.
1 janv. 1975
Maximum:
223.276 mln.
1 janv. 2014
Pour la date d''observation
Valeur
Changement absolu
Le changement par rapport à la valeur précédente
1 janv. 1975
1.786 mln.
+1.786 mln.
0.0%
1 janv. 1976
4.764 mln.
+2.978 mln.
166.68%
1 janv. 1977
3.155 mln.
-1.609 mln.
-33.77%
1 janv. 1978
3.614 mln.
+458.997 milles
14.55%
1 janv. 1979
3.674 mln.
+59.273 milles
1.64%
1 janv. 1980
4.781 mln.
+1.107 mln.
30.14%
1 janv. 1981
6.945 mln.
+2.164 mln.
45.27%
1 janv. 1982
10.015 mln.
+3.07 mln.
44.2%
1 janv. 1983
29.619 mln.
+19.604 mln.
195.74%
1 janv. 1984
51.844 mln.
+22.225 mln.
75.04%
1 janv. 1985
55.445 mln.
+3.601 mln.
6.95%
1 janv. 1986
34.724 mln.
-20.721 mln.
-37.37%
1 janv. 1987
28.876 mln.
-5.847 mln.
-16.84%
1 janv. 1988
31.961 mln.
+3.085 mln.
10.68%
1 janv. 1989
37.03 mln.
+5.069 mln.
15.86%
1 janv. 1990
36.104 mln.
-926.172 milles
-2.5%
1 janv. 1991
37.721 mln.
+1.617 mln.
4.48%
1 janv. 1992
39.47 mln.
+1.75 mln.
4.64%
1 janv. 1993
27.112 mln.
-12.358 mln.
-31.31%
1 janv. 1994
32.798 mln.
+5.685 mln.
20.97%
1 janv. 1995
21.677 mln.
-11.121 mln.
-33.91%
1 janv. 1996
31.061 mln.
+9.384 mln.
43.29%
1 janv. 1997
57.496 mln.
+26.435 mln.
85.11%
1 janv. 1998
45.392 mln.
-12.103 mln.
-21.05%
1 janv. 1999
44.471 mln.
-920.705 milles
-2.03%
1 janv. 2000
39.069 mln.
-5.402 mln.
-12.15%
1 janv. 2001
35.736 mln.
-3.334 mln.
-8.53%
1 janv. 2002
35.808 mln.
+72.746 milles
0.2%
1 janv. 2003
46.623 mln.
+10.815 mln.
30.2%
1 janv. 2004
60.852 mln.
+14.228 mln.
30.52%
1 janv. 2005
59.864 mln.
-988.111 milles
-1.62%
1 janv. 2006
43.165 mln.
-16.699 mln.
-27.89%
1 janv. 2007
54.046 mln.
+10.881 mln.
25.21%
1 janv. 2008
86.079 mln.
+32.034 mln.
59.27%
1 janv. 2009
56.212 mln.
-29.867 mln.
-34.7%
1 janv. 2010
76.089 mln.
+19.877 mln.
35.36%
1 janv. 2011
102.88 mln.
+26.791 mln.
35.21%
1 janv. 2012
119.036 mln.
+16.156 mln.
15.7%
1 janv. 2013
158.946 mln.
+39.91 mln.
33.53%
1 janv. 2014
223.276 mln.
+64.33 mln.
40.47%
1 janv. 2015
217.762 mln.
-5.514 mln.
-2.47%
Classement des pays selon les statistiques actuelles par années


Commentaires: