29
/fr/
fr
AIzaSyAYiBZKx7MnpbEhh9jyipgxe19OcubqV5w
April 1, 2024
180342
Libya
LBY
true
2
1
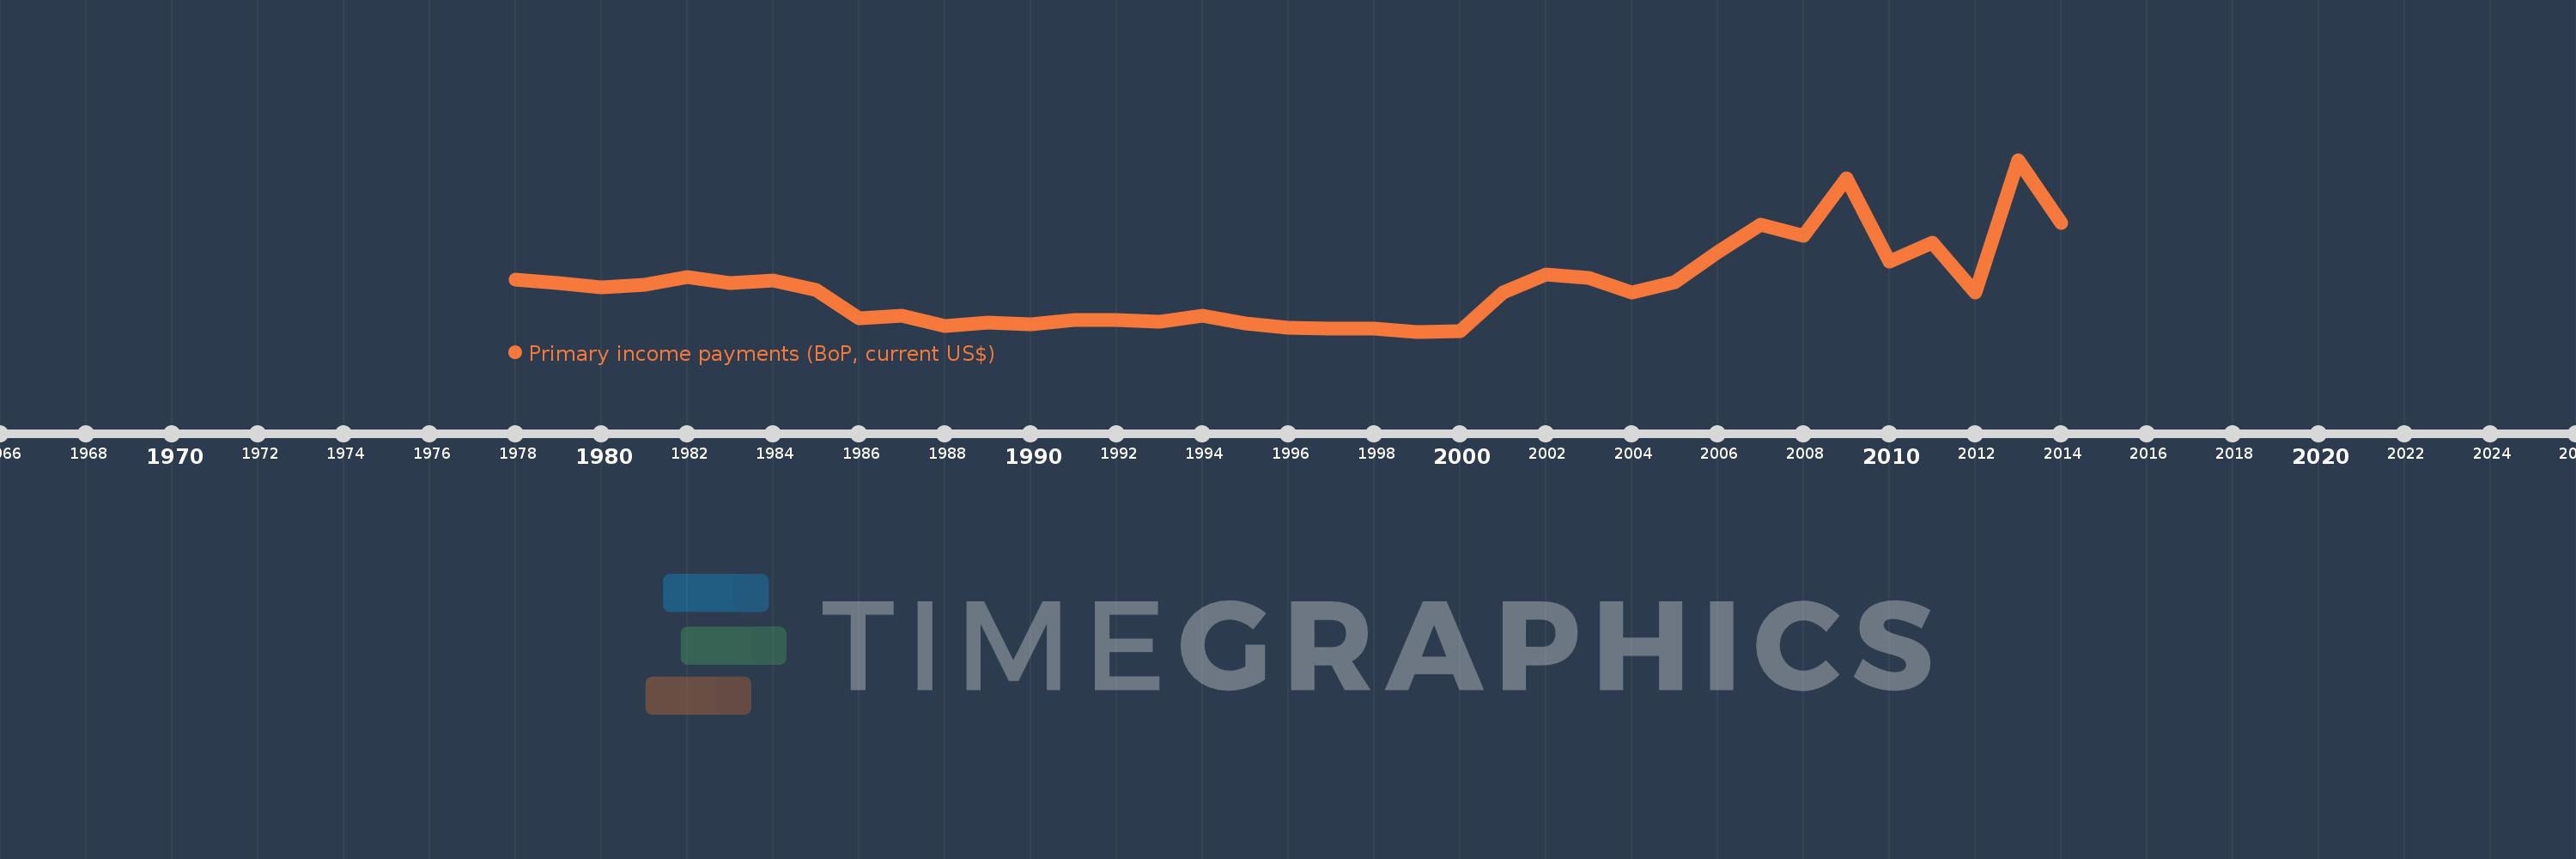
Primary income payments (BoP, current US$)
2014,2013,2012,2011,2010,2009,2008,2007,2006,2005,2004,2003,2002,2001,2000,1999,1998,1997,1996,1995,1994,1993,1992,1991,1990,1989,1988,1987,1986,1985,1984,1983,1982,1981,1980,1979,1978
Cette statistique dans les autres pays:
AfghanistanAlbaniaAlgeriaAngolaAntigua and BarbudaArab WorldArgentinaArmeniaArubaAustraliaAustriaAzerbaijanBahamas, TheBahrainBangladeshBarbadosBelarusBelgiumBelizeBeninBermudaBhutanBoliviaBosnia and HerzegovinaBotswanaBrazilBrunei DarussalamBulgariaBurkina FasoBurundiCabo VerdeCambodiaCameroonCanadaCaribbean small statesCentral African RepublicCentral Europe and the BalticsChadChileChinaColombiaComorosCongo, Dem. Rep.Congo, Rep.Costa RicaCote d'IvoireCroatiaCuracaoCyprusCzech RepublicDenmarkDjiboutiDominicaDominican RepublicEarly-demographic dividendEast Asia & PacificEast Asia & Pacific (excluding high income)East Asia & Pacific (IDA & IBRD countries)EcuadorEgypt, Arab Rep.El SalvadorEquatorial GuineaEritreaEstoniaEthiopiaEuro areaEurope & Central AsiaEurope & Central Asia (excluding high income)Europe & Central Asia (IDA & IBRD countries)European UnionFaroe IslandsFijiFinlandFragile and conflict affected situationsFranceFrench PolynesiaGabonGambia, TheGeorgiaGermanyGhanaGreeceGrenadaGuatemalaGuineaGuinea-BissauGuyanaHaitiHeavily indebted poor countries (HIPC)High incomeHondurasHong Kong SAR, ChinaHungaryIBRD onlyIcelandIDA & IBRD totalIDA blendIDA onlyIDA totalIndiaIndonesiaIran, Islamic Rep.IraqIrelandIsraelItalyJamaicaJapanJordanKazakhstanKenyaKiribatiKorea, Rep.KosovoKuwaitKyrgyz RepublicLao PDRLate-demographic dividendLatin America & Caribbean Latin America & Caribbean (excluding high income)Latin America & the Caribbean (IDA & IBRD countries)LatviaLeast developed countries: UN classificationLebanonLesothoLiberiaLibyaLithuaniaLow & middle incomeLow incomeLower middle incomeLuxembourgMacao SAR, ChinaMacedonia, FYRMadagascarMalawiMalaysiaMaldivesMaliMaltaMarshall IslandsMauritaniaMauritiusMexicoMicronesia, Fed. Sts.Middle East & North AfricaMiddle East & North Africa (excluding high income)Middle East & North Africa (IDA & IBRD countries)Middle incomeMoldovaMongoliaMontenegroMoroccoMozambiqueMyanmarNamibiaNepalNetherlandsNew CaledoniaNew ZealandNicaraguaNigerNigeriaNorth AmericaNorwayOECD membersOmanOther small statesPacific island small statesPakistanPalauPanamaPapua New GuineaParaguayPeruPhilippinesPolandPortugalPost-demographic dividendPre-demographic dividendQatarRomaniaRussian FederationRwandaSamoaSao Tome and PrincipeSaudi ArabiaSenegalSerbiaSeychellesSierra LeoneSingaporeSint Maarten (Dutch part)Slovak RepublicSloveniaSmall statesSolomon IslandsSouth AfricaSouth AsiaSouth Asia (IDA & IBRD)South SudanSpainSri LankaSt. Kitts and NevisSt. LuciaSt. Vincent and the GrenadinesSub-Saharan Africa Sub-Saharan Africa (excluding high income)Sub-Saharan Africa (IDA & IBRD countries)SudanSurinameSwazilandSwedenSwitzerlandSyrian Arab RepublicTajikistanTanzaniaThailandTimor-LesteTogoTongaTrinidad and TobagoTunisiaTurkeyTuvaluUgandaUkraineUnited KingdomUnited StatesUpper middle incomeUruguayVanuatuVenezuela, RBVietnamWest Bank and GazaWorldYemen, Rep.ZambiaZimbabwe La ligne de temps
Cette échelle de temps montre un graphique de 1978 année à 2014 année Libya. Les données jusqu'à 1977 année ne sont pas présentés. Quantité d'observations actuelles selon dates: 37.
Source (désignation):
Les indicateurs du développement mondiale
Source (organisation):
International Monetary Fund, Balance of Payments Statistics Yearbook and data files.
Catégories:
Economy & Growth
Dernière mise à jour
23 avr. 2017
Les indicateurs de changement de valeurs selon les années
Minimum:
217.933 mln.
1 janv. 1999
Maximum:
4.324 mds
1 janv. 2013
Pour la date d''observation
Valeur
Changement absolu
Le changement par rapport à la valeur précédente
1 janv. 1978
1.459 mds
+1.459 mds
0.0%
1 janv. 1979
1.37 mds
-88.836 mln.
-6.09%
1 janv. 1980
1.273 mds
-96.943 mln.
-7.07%
1 janv. 1981
1.347 mds
+73.299 mln.
5.76%
1 janv. 1982
1.517 mds
+170.574 mln.
12.67%
1 janv. 1983
1.376 mds
-140.86 mln.
-9.28%
1 janv. 1984
1.433 mds
+56.409 mln.
4.1%
1 janv. 1985
1.218 mds
-215.164 mln.
-15.02%
1 janv. 1986
539.768 mln.
-677.919 mln.
-55.67%
1 janv. 1987
590.369 mln.
+50.601 mln.
9.37%
1 janv. 1988
360.571 mln.
-229.798 mln.
-38.92%
1 janv. 1989
437.421 mln.
+76.849 mln.
21.31%
1 janv. 1990
387.515 mln.
-49.906 mln.
-11.41%
1 janv. 1991
492.624 mln.
+105.11 mln.
27.12%
1 janv. 1992
502.265 mln.
+9.641 mln.
1.96%
1 janv. 1993
451.779 mln.
-50.486 mln.
-10.05%
1 janv. 1994
601.57 mln.
+149.791 mln.
33.16%
1 janv. 1995
403.309 mln.
-198.261 mln.
-32.96%
1 janv. 1996
302.048 mln.
-101.261 mln.
-25.11%
1 janv. 1997
294.643 mln.
-7.405 mln.
-2.45%
1 janv. 1998
293.144 mln.
-1.499 mln.
-0.51%
1 janv. 1999
217.933 mln.
-75.21 mln.
-25.66%
1 janv. 2000
235.01 mln.
+17.076 mln.
7.84%
1 janv. 2001
1.152 mds
+916.99 mln.
390.19%
1 janv. 2002
1.583 mds
+431.0 mln.
37.41%
1 janv. 2003
1.508 mds
-75.0 mln.
-4.74%
1 janv. 2004
1.149 mds
-359.0 mln.
-23.81%
1 janv. 2005
1.394 mds
+245.0 mln.
21.32%
1 janv. 2006
2.118 mds
+724.0 mln.
51.94%
1 janv. 2007
2.775 mds
+657.0 mln.
31.02%
1 janv. 2008
2.5 mds
-275.0 mln.
-9.91%
1 janv. 2009
3.885 mds
+1.385 mds
55.39%
1 janv. 2010
1.883 mds
-2.001 mds
-51.52%
1 janv. 2011
2.348 mds
+464.7 mln.
24.67%
1 janv. 2012
1.154 mds
-1.194 mds
-50.85%
1 janv. 2013
4.324 mds
+3.17 mds
274.68%
1 janv. 2014
2.808 mds
-1.516 mds
-35.06%
Classement des pays selon les statistiques actuelles par années


Commentaires: