29
/fr/
fr
AIzaSyAYiBZKx7MnpbEhh9jyipgxe19OcubqV5w
April 1, 2024
240888
Singapore
SGP
true
2
1
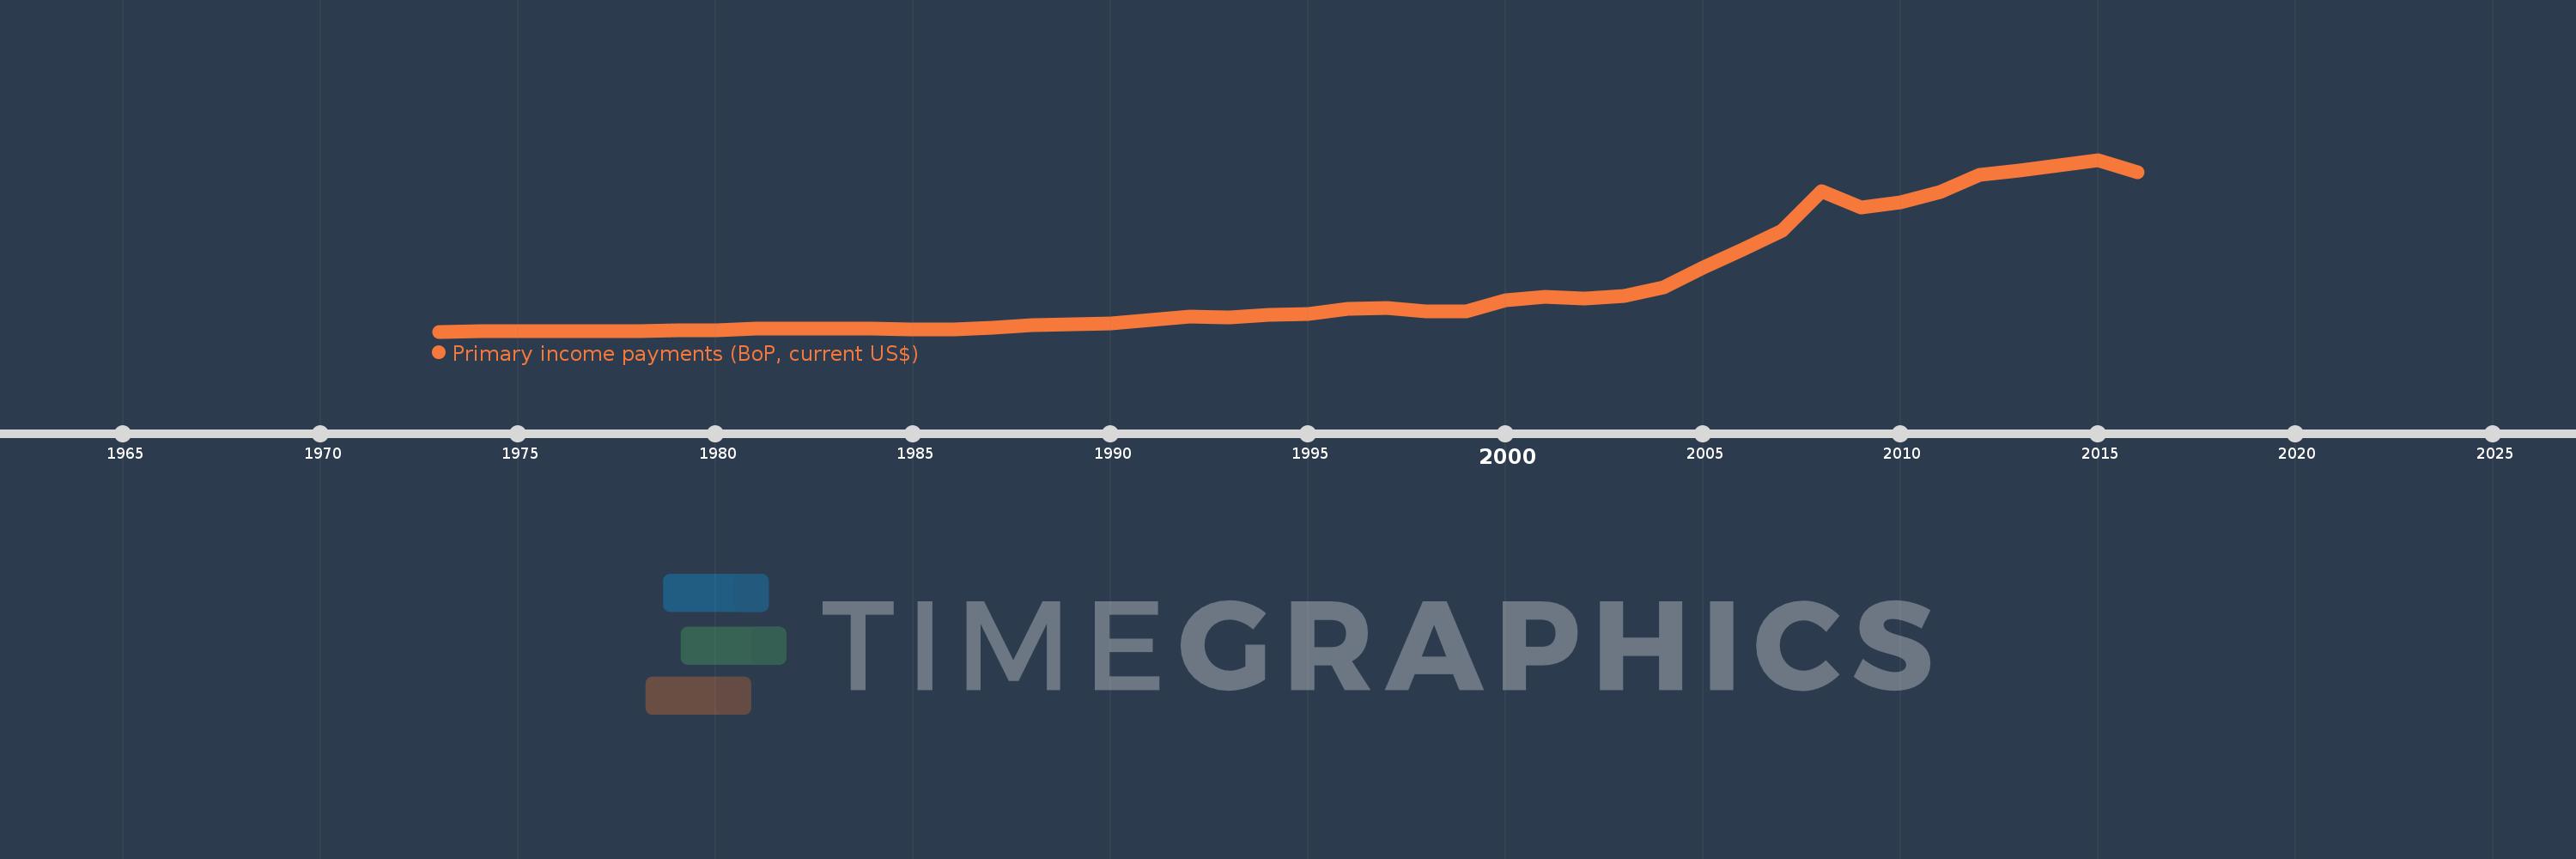
Primary income payments (BoP, current US$)
2016,2015,2014,2013,2012,2011,2010,2009,2008,2007,2006,2005,2004,2003,2002,2001,2000,1999,1998,1997,1996,1995,1994,1993,1992,1991,1990,1989,1988,1987,1986,1985,1984,1983,1982,1981,1980,1979,1978,1977,1976,1975,1974,1973
Cette statistique dans les autres pays:
AfghanistanAlbaniaAlgeriaAngolaAntigua and BarbudaArab WorldArgentinaArmeniaArubaAustraliaAustriaAzerbaijanBahamas, TheBahrainBangladeshBarbadosBelarusBelgiumBelizeBeninBermudaBhutanBoliviaBosnia and HerzegovinaBotswanaBrazilBrunei DarussalamBulgariaBurkina FasoBurundiCabo VerdeCambodiaCameroonCanadaCaribbean small statesCentral African RepublicCentral Europe and the BalticsChadChileChinaColombiaComorosCongo, Dem. Rep.Congo, Rep.Costa RicaCote d'IvoireCroatiaCuracaoCyprusCzech RepublicDenmarkDjiboutiDominicaDominican RepublicEarly-demographic dividendEast Asia & PacificEast Asia & Pacific (excluding high income)East Asia & Pacific (IDA & IBRD countries)EcuadorEgypt, Arab Rep.El SalvadorEquatorial GuineaEritreaEstoniaEthiopiaEuro areaEurope & Central AsiaEurope & Central Asia (excluding high income)Europe & Central Asia (IDA & IBRD countries)European UnionFaroe IslandsFijiFinlandFragile and conflict affected situationsFranceFrench PolynesiaGabonGambia, TheGeorgiaGermanyGhanaGreeceGrenadaGuatemalaGuineaGuinea-BissauGuyanaHaitiHeavily indebted poor countries (HIPC)High incomeHondurasHong Kong SAR, ChinaHungaryIBRD onlyIcelandIDA & IBRD totalIDA blendIDA onlyIDA totalIndiaIndonesiaIran, Islamic Rep.IraqIrelandIsraelItalyJamaicaJapanJordanKazakhstanKenyaKiribatiKorea, Rep.KosovoKuwaitKyrgyz RepublicLao PDRLate-demographic dividendLatin America & Caribbean Latin America & Caribbean (excluding high income)Latin America & the Caribbean (IDA & IBRD countries)LatviaLeast developed countries: UN classificationLebanonLesothoLiberiaLibyaLithuaniaLow & middle incomeLow incomeLower middle incomeLuxembourgMacao SAR, ChinaMacedonia, FYRMadagascarMalawiMalaysiaMaldivesMaliMaltaMarshall IslandsMauritaniaMauritiusMexicoMicronesia, Fed. Sts.Middle East & North AfricaMiddle East & North Africa (excluding high income)Middle East & North Africa (IDA & IBRD countries)Middle incomeMoldovaMongoliaMontenegroMoroccoMozambiqueMyanmarNamibiaNepalNetherlandsNew CaledoniaNew ZealandNicaraguaNigerNigeriaNorth AmericaNorwayOECD membersOmanOther small statesPacific island small statesPakistanPalauPanamaPapua New GuineaParaguayPeruPhilippinesPolandPortugalPost-demographic dividendPre-demographic dividendQatarRomaniaRussian FederationRwandaSamoaSao Tome and PrincipeSaudi ArabiaSenegalSerbiaSeychellesSierra LeoneSingaporeSint Maarten (Dutch part)Slovak RepublicSloveniaSmall statesSolomon IslandsSouth AfricaSouth AsiaSouth Asia (IDA & IBRD)South SudanSpainSri LankaSt. Kitts and NevisSt. LuciaSt. Vincent and the GrenadinesSub-Saharan Africa Sub-Saharan Africa (excluding high income)Sub-Saharan Africa (IDA & IBRD countries)SudanSurinameSwazilandSwedenSwitzerlandSyrian Arab RepublicTajikistanTanzaniaThailandTimor-LesteTogoTongaTrinidad and TobagoTunisiaTurkeyTuvaluUgandaUkraineUnited KingdomUnited StatesUpper middle incomeUruguayVanuatuVenezuela, RBVietnamWest Bank and GazaWorldYemen, Rep.ZambiaZimbabwe La ligne de temps
Cette échelle de temps montre un graphique de 1973 année à 2016 année Singapore. Les données jusqu'à 1972 année ne sont pas présentés. Quantité d'observations actuelles selon dates: 44.
Source (désignation):
Les indicateurs du développement mondiale
Source (organisation):
International Monetary Fund, Balance of Payments Statistics Yearbook and data files.
Catégories:
Economy & Growth
Dernière mise à jour
23 avr. 2017
Les indicateurs de changement de valeurs selon les années
Minimum:
129.067 mln.
1 janv. 1973
Maximum:
78.462 mds
1 janv. 2015
Pour la date d''observation
Valeur
Changement absolu
Le changement par rapport à la valeur précédente
1 janv. 1973
129.067 mln.
+129.067 mln.
0.0%
1 janv. 1974
267.766 mln.
+138.7 mln.
107.46%
1 janv. 1975
379.996 mln.
+112.23 mln.
41.91%
1 janv. 1976
344.958 mln.
-35.038 mln.
-9.22%
1 janv. 1977
409.577 mln.
+64.619 mln.
18.73%
1 janv. 1978
475.117 mln.
+65.54 mln.
16.0%
1 janv. 1979
553.644 mln.
+78.527 mln.
16.53%
1 janv. 1980
849.368 mln.
+295.724 mln.
53.41%
1 janv. 1981
1.382 mds
+533.029 mln.
62.76%
1 janv. 1982
1.644 mds
+261.951 mln.
18.95%
1 janv. 1983
1.668 mds
+23.857 mln.
1.45%
1 janv. 1984
1.39 mds
-277.798 mln.
-16.65%
1 janv. 1985
1.252 mds
-138.698 mln.
-9.98%
1 janv. 1986
1.26 mds
+8.659 mln.
0.69%
1 janv. 1987
1.786 mds
+525.693 mln.
41.71%
1 janv. 1988
2.884 mds
+1.098 mds
61.47%
1 janv. 1989
3.495 mds
+610.711 mln.
21.18%
1 janv. 1990
3.959 mds
+464.68 mln.
13.3%
1 janv. 1991
5.502 mds
+1.543 mds
38.96%
1 janv. 1992
6.801 mds
+1.299 mds
23.62%
1 janv. 1993
6.666 mds
-134.696 mln.
-1.98%
1 janv. 1994
7.88 mds
+1.214 mds
18.21%
1 janv. 1995
8.222 mds
+342.2 mln.
4.34%
1 janv. 1996
10.524 mds
+2.301 mds
27.99%
1 janv. 1997
10.951 mds
+427.705 mln.
4.06%
1 janv. 1998
9.162 mds
-1.789 mds
-16.33%
1 janv. 1999
9.445 mds
+282.781 mln.
3.09%
1 janv. 2000
14.411 mds
+4.966 mds
52.58%
1 janv. 2001
15.917 mds
+1.505 mds
10.44%
1 janv. 2002
15.109 mds
-807.711 mln.
-5.07%
1 janv. 2003
16.51 mds
+1.401 mds
9.27%
1 janv. 2004
20.414 mds
+3.904 mds
23.65%
1 janv. 2005
29.375 mds
+8.962 mds
43.9%
1 janv. 2006
37.628 mds
+8.253 mds
28.09%
1 janv. 2007
46.224 mds
+8.596 mds
22.84%
1 janv. 2008
64.052 mds
+17.828 mds
38.57%
1 janv. 2009
56.616 mds
-7.436 mds
-11.61%
1 janv. 2010
59.117 mds
+2.501 mds
4.42%
1 janv. 2011
63.966 mds
+4.848 mds
8.2%
1 janv. 2012
71.672 mds
+7.706 mds
12.05%
1 janv. 2013
73.739 mds
+2.067 mds
2.88%
1 janv. 2014
76.005 mds
+2.266 mds
3.07%
1 janv. 2015
78.462 mds
+2.457 mds
3.23%
1 janv. 2016
72.639 mds
-5.823 mds
-7.42%
Classement des pays selon les statistiques actuelles par années


Commentaires: