29
/fr/
fr
AIzaSyAYiBZKx7MnpbEhh9jyipgxe19OcubqV5w
April 1, 2024
133553
Finland
FIN
true
2
1
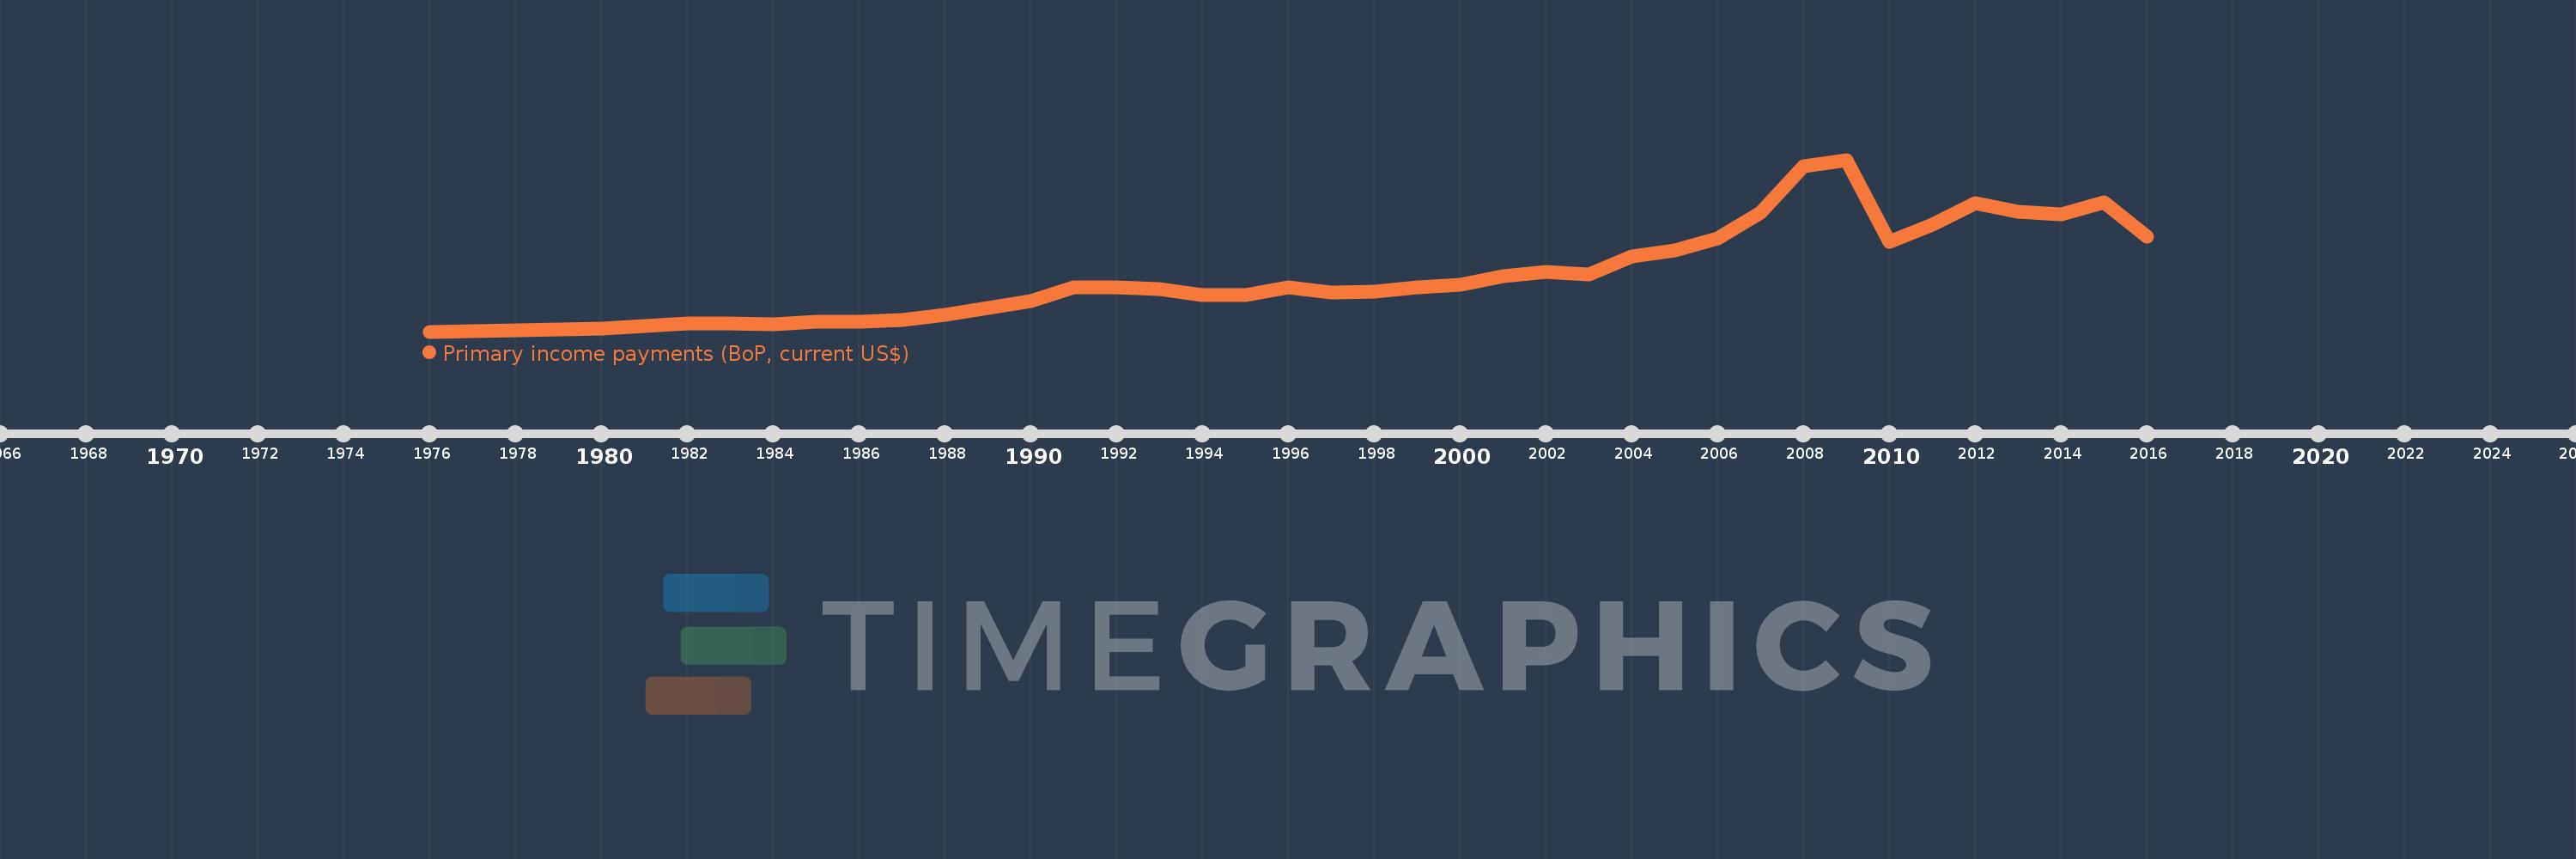
Primary income payments (BoP, current US$)
2016,2015,2014,2013,2012,2011,2010,2009,2008,2007,2006,2005,2004,2003,2002,2001,2000,1999,1998,1997,1996,1995,1994,1993,1992,1991,1990,1989,1988,1987,1986,1985,1984,1983,1982,1981,1980,1979,1978,1977,1976
Cette statistique dans les autres pays:
AfghanistanAlbaniaAlgeriaAngolaAntigua and BarbudaArab WorldArgentinaArmeniaArubaAustraliaAustriaAzerbaijanBahamas, TheBahrainBangladeshBarbadosBelarusBelgiumBelizeBeninBermudaBhutanBoliviaBosnia and HerzegovinaBotswanaBrazilBrunei DarussalamBulgariaBurkina FasoBurundiCabo VerdeCambodiaCameroonCanadaCaribbean small statesCentral African RepublicCentral Europe and the BalticsChadChileChinaColombiaComorosCongo, Dem. Rep.Congo, Rep.Costa RicaCote d'IvoireCroatiaCuracaoCyprusCzech RepublicDenmarkDjiboutiDominicaDominican RepublicEarly-demographic dividendEast Asia & PacificEast Asia & Pacific (excluding high income)East Asia & Pacific (IDA & IBRD countries)EcuadorEgypt, Arab Rep.El SalvadorEquatorial GuineaEritreaEstoniaEthiopiaEuro areaEurope & Central AsiaEurope & Central Asia (excluding high income)Europe & Central Asia (IDA & IBRD countries)European UnionFaroe IslandsFijiFinlandFragile and conflict affected situationsFranceFrench PolynesiaGabonGambia, TheGeorgiaGermanyGhanaGreeceGrenadaGuatemalaGuineaGuinea-BissauGuyanaHaitiHeavily indebted poor countries (HIPC)High incomeHondurasHong Kong SAR, ChinaHungaryIBRD onlyIcelandIDA & IBRD totalIDA blendIDA onlyIDA totalIndiaIndonesiaIran, Islamic Rep.IraqIrelandIsraelItalyJamaicaJapanJordanKazakhstanKenyaKiribatiKorea, Rep.KosovoKuwaitKyrgyz RepublicLao PDRLate-demographic dividendLatin America & Caribbean Latin America & Caribbean (excluding high income)Latin America & the Caribbean (IDA & IBRD countries)LatviaLeast developed countries: UN classificationLebanonLesothoLiberiaLibyaLithuaniaLow & middle incomeLow incomeLower middle incomeLuxembourgMacao SAR, ChinaMacedonia, FYRMadagascarMalawiMalaysiaMaldivesMaliMaltaMarshall IslandsMauritaniaMauritiusMexicoMicronesia, Fed. Sts.Middle East & North AfricaMiddle East & North Africa (excluding high income)Middle East & North Africa (IDA & IBRD countries)Middle incomeMoldovaMongoliaMontenegroMoroccoMozambiqueMyanmarNamibiaNepalNetherlandsNew CaledoniaNew ZealandNicaraguaNigerNigeriaNorth AmericaNorwayOECD membersOmanOther small statesPacific island small statesPakistanPalauPanamaPapua New GuineaParaguayPeruPhilippinesPolandPortugalPost-demographic dividendPre-demographic dividendQatarRomaniaRussian FederationRwandaSamoaSao Tome and PrincipeSaudi ArabiaSenegalSerbiaSeychellesSierra LeoneSingaporeSint Maarten (Dutch part)Slovak RepublicSloveniaSmall statesSolomon IslandsSouth AfricaSouth AsiaSouth Asia (IDA & IBRD)South SudanSpainSri LankaSt. Kitts and NevisSt. LuciaSt. Vincent and the GrenadinesSub-Saharan Africa Sub-Saharan Africa (excluding high income)Sub-Saharan Africa (IDA & IBRD countries)SudanSurinameSwazilandSwedenSwitzerlandSyrian Arab RepublicTajikistanTanzaniaThailandTimor-LesteTogoTongaTrinidad and TobagoTunisiaTurkeyTuvaluUgandaUkraineUnited KingdomUnited StatesUpper middle incomeUruguayVanuatuVenezuela, RBVietnamWest Bank and GazaWorldYemen, Rep.ZambiaZimbabwe La ligne de temps
Cette échelle de temps montre un graphique de 1976 année à 2016 année Finland. Les données jusqu'à 1975 année ne sont pas présentés. Quantité d'observations actuelles selon dates: 41.
Source (désignation):
Les indicateurs du développement mondiale
Source (organisation):
International Monetary Fund, Balance of Payments Statistics Yearbook and data files.
Catégories:
Economy & Growth
Dernière mise à jour
23 avr. 2017
Les indicateurs de changement de valeurs selon les années
Minimum:
504.443 mln.
1 janv. 1976
Maximum:
26.73 mds
1 janv. 2009
Pour la date d''observation
Valeur
Changement absolu
Le changement par rapport à la valeur précédente
1 janv. 1976
504.443 mln.
+504.443 mln.
0.0%
1 janv. 1977
565.979 mln.
+61.535 mln.
12.2%
1 janv. 1978
708.568 mln.
+142.589 mln.
25.19%
1 janv. 1979
823.186 mln.
+114.619 mln.
16.18%
1 janv. 1980
1.011 mds
+188.076 mln.
22.85%
1 janv. 1981
1.313 mds
+301.864 mln.
29.85%
1 janv. 1982
1.716 mds
+402.386 mln.
30.64%
1 janv. 1983
1.766 mds
+50.394 mln.
2.94%
1 janv. 1984
1.67 mds
-95.491 mln.
-5.41%
1 janv. 1985
1.967 mds
+296.571 mln.
17.75%
1 janv. 1986
2.014 mds
+46.545 mln.
2.37%
1 janv. 1987
2.309 mds
+295.798 mln.
14.69%
1 janv. 1988
3.074 mds
+764.721 mln.
33.11%
1 janv. 1989
4.09 mds
+1.016 mds
33.06%
1 janv. 1990
5.192 mds
+1.102 mds
26.93%
1 janv. 1991
7.239 mds
+2.047 mds
39.43%
1 janv. 1992
7.279 mds
+40.138 mln.
0.55%
1 janv. 1993
6.946 mds
-332.958 mln.
-4.57%
1 janv. 1994
6.086 mds
-860.951 mln.
-12.39%
1 janv. 1995
6.103 mds
+17.699 mln.
0.29%
1 janv. 1996
7.318 mds
+1.215 mds
19.91%
1 janv. 1997
6.503 mds
-815.328 mln.
-11.14%
1 janv. 1998
6.6 mds
+96.562 mln.
1.48%
1 janv. 1999
7.32 mds
+720.533 mln.
10.92%
1 janv. 2000
7.712 mds
+392.417 mln.
5.36%
1 janv. 2001
8.989 mds
+1.277 mds
16.55%
1 janv. 2002
9.573 mds
+584.001 mln.
6.5%
1 janv. 2003
9.21 mds
-363.096 mln.
-3.79%
1 janv. 2004
11.98 mds
+2.77 mds
30.08%
1 janv. 2005
12.884 mds
+903.862 mln.
7.54%
1 janv. 2006
14.75 mds
+1.866 mds
14.49%
1 janv. 2007
18.637 mds
+3.887 mds
26.35%
1 janv. 2008
25.694 mds
+7.056 mds
37.86%
1 janv. 2009
26.73 mds
+1.036 mds
4.03%
1 janv. 2010
14.262 mds
-12.468 mds
-46.64%
1 janv. 2011
16.776 mds
+2.514 mds
17.62%
1 janv. 2012
20.167 mds
+3.391 mds
20.21%
1 janv. 2013
18.82 mds
-1.346 mds
-6.68%
1 janv. 2014
18.417 mds
-403.408 mln.
-2.14%
1 janv. 2015
20.289 mds
+1.872 mds
10.16%
1 janv. 2016
14.978 mds
-5.31 mds
-26.17%
Classement des pays selon les statistiques actuelles par années


Commentaires: