29
/fr/
fr
AIzaSyAYiBZKx7MnpbEhh9jyipgxe19OcubqV5w
April 1, 2024
146254
Guinea
GIN
true
2
1
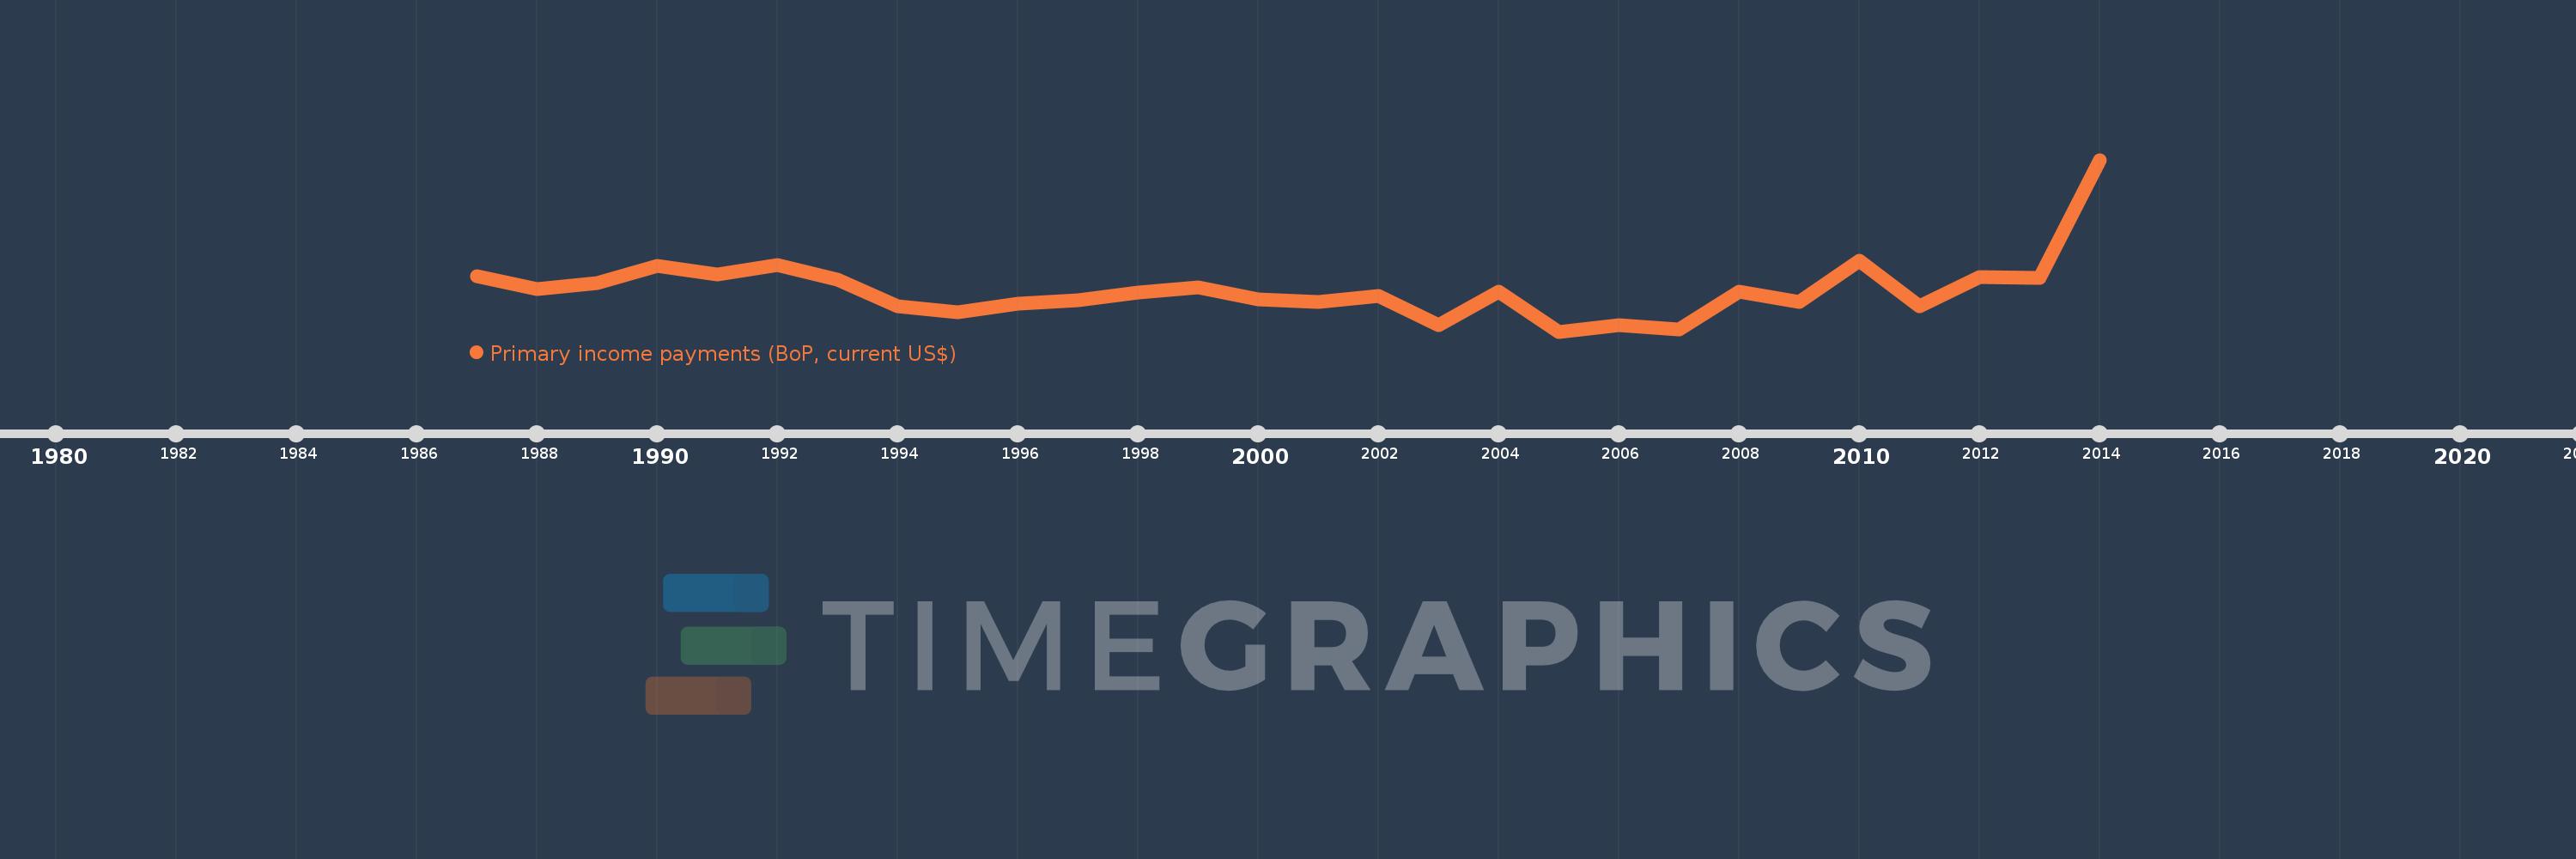
Primary income payments (BoP, current US$)
2014,2013,2012,2011,2010,2009,2008,2007,2006,2005,2004,2003,2002,2001,2000,1999,1998,1997,1996,1995,1994,1993,1992,1991,1990,1989,1988,1987
Cette statistique dans les autres pays:
AfghanistanAlbaniaAlgeriaAngolaAntigua and BarbudaArab WorldArgentinaArmeniaArubaAustraliaAustriaAzerbaijanBahamas, TheBahrainBangladeshBarbadosBelarusBelgiumBelizeBeninBermudaBhutanBoliviaBosnia and HerzegovinaBotswanaBrazilBrunei DarussalamBulgariaBurkina FasoBurundiCabo VerdeCambodiaCameroonCanadaCaribbean small statesCentral African RepublicCentral Europe and the BalticsChadChileChinaColombiaComorosCongo, Dem. Rep.Congo, Rep.Costa RicaCote d'IvoireCroatiaCuracaoCyprusCzech RepublicDenmarkDjiboutiDominicaDominican RepublicEarly-demographic dividendEast Asia & PacificEast Asia & Pacific (excluding high income)East Asia & Pacific (IDA & IBRD countries)EcuadorEgypt, Arab Rep.El SalvadorEquatorial GuineaEritreaEstoniaEthiopiaEuro areaEurope & Central AsiaEurope & Central Asia (excluding high income)Europe & Central Asia (IDA & IBRD countries)European UnionFaroe IslandsFijiFinlandFragile and conflict affected situationsFranceFrench PolynesiaGabonGambia, TheGeorgiaGermanyGhanaGreeceGrenadaGuatemalaGuineaGuinea-BissauGuyanaHaitiHeavily indebted poor countries (HIPC)High incomeHondurasHong Kong SAR, ChinaHungaryIBRD onlyIcelandIDA & IBRD totalIDA blendIDA onlyIDA totalIndiaIndonesiaIran, Islamic Rep.IraqIrelandIsraelItalyJamaicaJapanJordanKazakhstanKenyaKiribatiKorea, Rep.KosovoKuwaitKyrgyz RepublicLao PDRLate-demographic dividendLatin America & Caribbean Latin America & Caribbean (excluding high income)Latin America & the Caribbean (IDA & IBRD countries)LatviaLeast developed countries: UN classificationLebanonLesothoLiberiaLibyaLithuaniaLow & middle incomeLow incomeLower middle incomeLuxembourgMacao SAR, ChinaMacedonia, FYRMadagascarMalawiMalaysiaMaldivesMaliMaltaMarshall IslandsMauritaniaMauritiusMexicoMicronesia, Fed. Sts.Middle East & North AfricaMiddle East & North Africa (excluding high income)Middle East & North Africa (IDA & IBRD countries)Middle incomeMoldovaMongoliaMontenegroMoroccoMozambiqueMyanmarNamibiaNepalNetherlandsNew CaledoniaNew ZealandNicaraguaNigerNigeriaNorth AmericaNorwayOECD membersOmanOther small statesPacific island small statesPakistanPalauPanamaPapua New GuineaParaguayPeruPhilippinesPolandPortugalPost-demographic dividendPre-demographic dividendQatarRomaniaRussian FederationRwandaSamoaSao Tome and PrincipeSaudi ArabiaSenegalSerbiaSeychellesSierra LeoneSingaporeSint Maarten (Dutch part)Slovak RepublicSloveniaSmall statesSolomon IslandsSouth AfricaSouth AsiaSouth Asia (IDA & IBRD)South SudanSpainSri LankaSt. Kitts and NevisSt. LuciaSt. Vincent and the GrenadinesSub-Saharan Africa Sub-Saharan Africa (excluding high income)Sub-Saharan Africa (IDA & IBRD countries)SudanSurinameSwazilandSwedenSwitzerlandSyrian Arab RepublicTajikistanTanzaniaThailandTimor-LesteTogoTongaTrinidad and TobagoTunisiaTurkeyTuvaluUgandaUkraineUnited KingdomUnited StatesUpper middle incomeUruguayVanuatuVenezuela, RBVietnamWest Bank and GazaWorldYemen, Rep.ZambiaZimbabwe La ligne de temps
Cette échelle de temps montre un graphique de 1987 année à 2014 année Guinea. Les données jusqu'à 1986 année ne sont pas présentés. Quantité d'observations actuelles selon dates: 28.
Source (désignation):
Les indicateurs du développement mondiale
Source (organisation):
International Monetary Fund, Balance of Payments Statistics Yearbook and data files.
Catégories:
Economy & Growth
Dernière mise à jour
23 avr. 2017
Les indicateurs de changement de valeurs selon les années
Minimum:
37.09 mln.
1 janv. 2005
Maximum:
408.8 mln.
1 janv. 2014
Pour la date d''observation
Valeur
Changement absolu
Le changement par rapport à la valeur précédente
1 janv. 1987
156.55 mln.
+156.55 mln.
0.0%
1 janv. 1988
128.76 mln.
-27.79 mln.
-17.75%
1 janv. 1989
142.4 mln.
+13.64 mln.
10.59%
1 janv. 1990
178.45 mln.
+36.05 mln.
25.32%
1 janv. 1991
161.5 mln.
-16.95 mln.
-9.5%
1 janv. 1992
181.39 mln.
+19.89 mln.
12.32%
1 janv. 1993
148.85 mln.
-32.54 mln.
-17.94%
1 janv. 1994
92.59 mln.
-56.26 mln.
-37.8%
1 janv. 1995
79.76 mln.
-12.83 mln.
-13.86%
1 janv. 1996
97.51 mln.
+17.75 mln.
22.25%
1 janv. 1997
105.72 mln.
+8.21 mln.
8.42%
1 janv. 1998
121.32 mln.
+15.6 mln.
14.76%
1 janv. 1999
133.54 mln.
+12.22 mln.
10.07%
1 janv. 2000
106.872 mln.
-26.668 mln.
-19.97%
1 janv. 2001
101.124 mln.
-5.747 mln.
-5.38%
1 janv. 2002
113.602 mln.
+12.478 mln.
12.34%
1 janv. 2003
51.582 mln.
-62.02 mln.
-54.59%
1 janv. 2004
124.327 mln.
+72.745 mln.
141.03%
1 janv. 2005
37.09 mln.
-87.237 mln.
-70.17%
1 janv. 2006
51.6 mln.
+14.51 mln.
39.12%
1 janv. 2007
42.24 mln.
-9.36 mln.
-18.14%
1 janv. 2008
124.13 mln.
+81.89 mln.
193.87%
1 janv. 2009
101.05 mln.
-23.08 mln.
-18.59%
1 janv. 2010
190.41 mln.
+89.36 mln.
88.43%
1 janv. 2011
92.04 mln.
-98.37 mln.
-51.66%
1 janv. 2012
155.63 mln.
+63.59 mln.
69.09%
1 janv. 2013
153.52 mln.
-2.11 mln.
-1.36%
1 janv. 2014
408.8 mln.
+255.28 mln.
166.28%
Classement des pays selon les statistiques actuelles par années


Commentaires: