29
/fr/
fr
AIzaSyAYiBZKx7MnpbEhh9jyipgxe19OcubqV5w
April 1, 2024
77798
Bangladesh
BGD
true
2
1
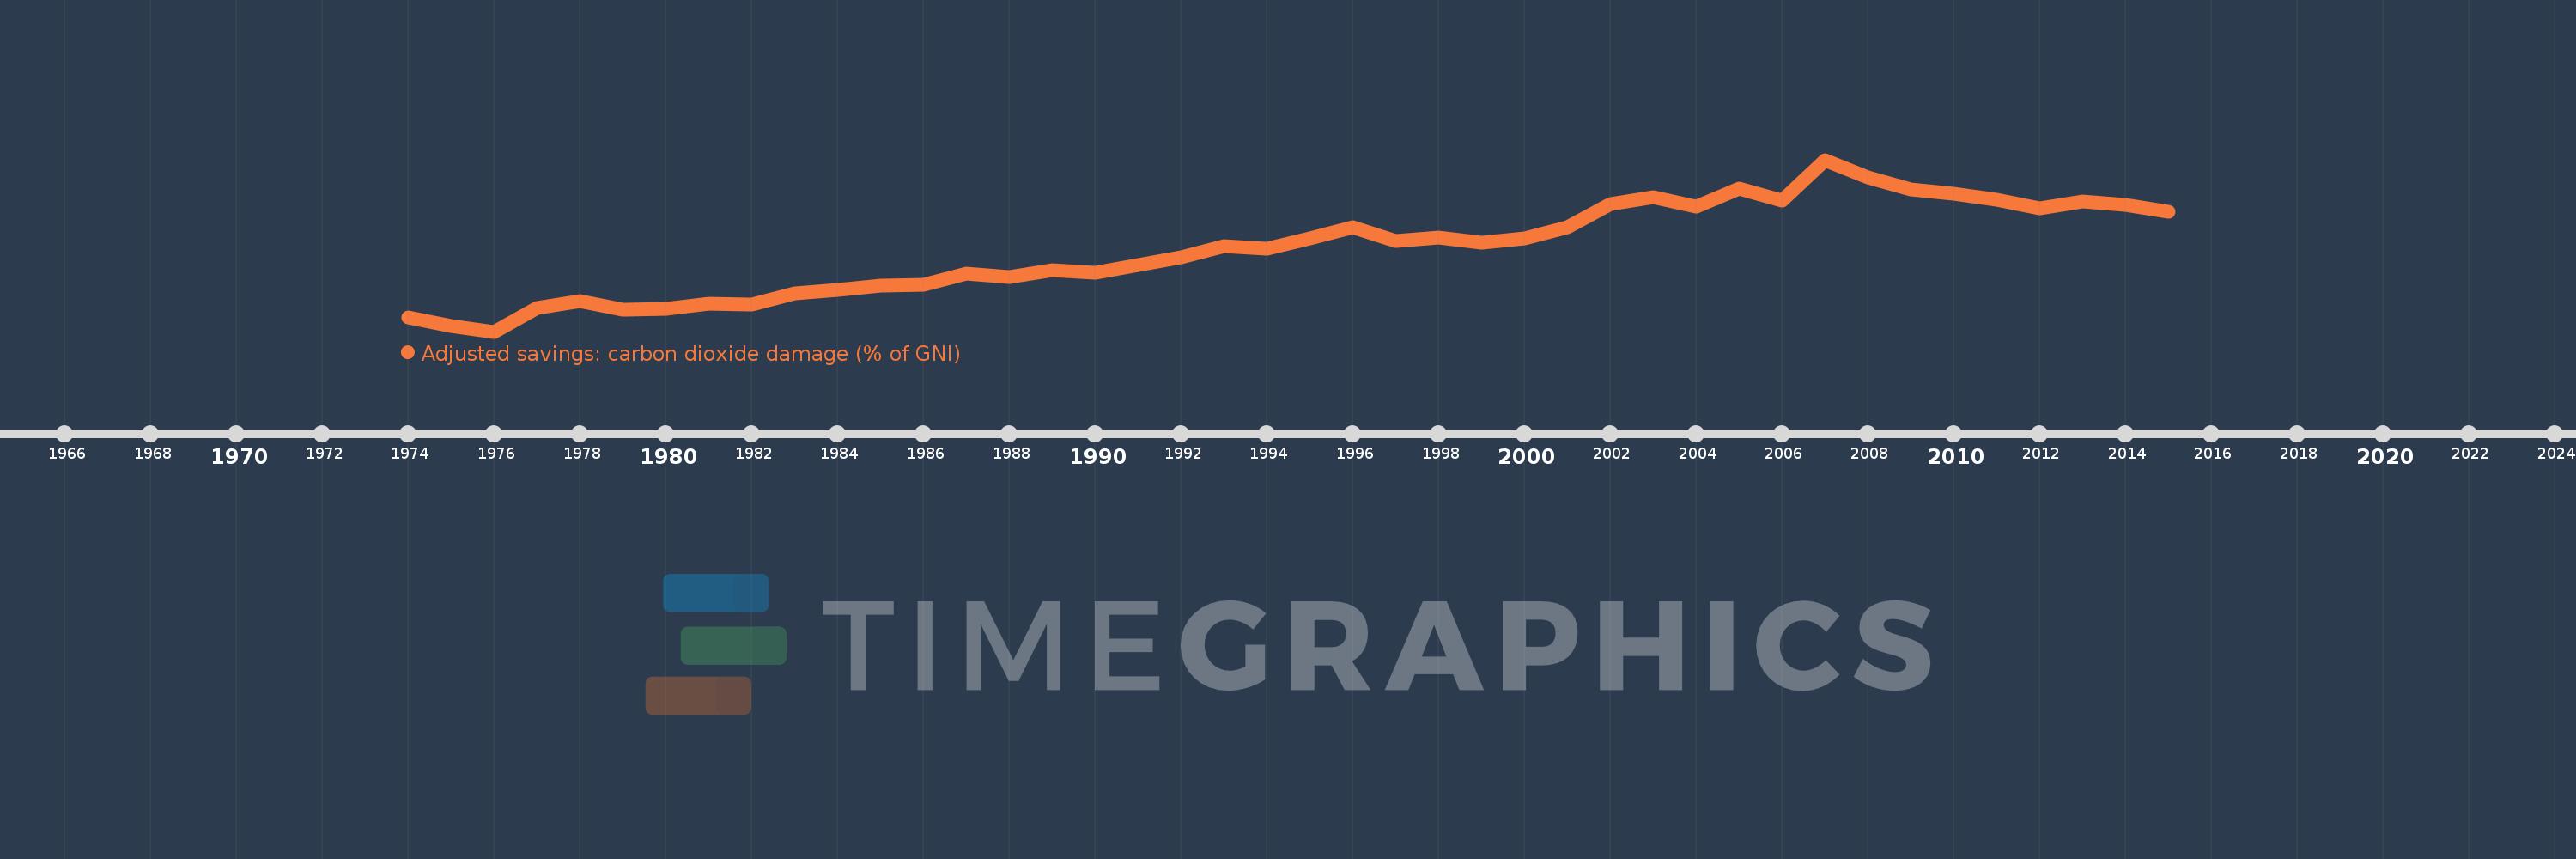
Adjusted savings: carbon dioxide damage (% of GNI)
2015,2014,2013,2012,2011,2010,2009,2008,2007,2006,2005,2004,2003,2002,2001,2000,1999,1998,1997,1996,1995,1994,1993,1992,1991,1990,1989,1988,1987,1986,1985,1984,1983,1982,1981,1980,1979,1978,1977,1976,1975,1974
Cette statistique dans les autres pays:
AfghanistanAlbaniaAlgeriaAndorraAngolaAntigua and BarbudaArab WorldArgentinaArmeniaAustraliaAustriaAzerbaijanBahamas, TheBahrainBangladeshBarbadosBelarusBelgiumBelizeBeninBermudaBhutanBoliviaBosnia and HerzegovinaBotswanaBrazilBrunei DarussalamBulgariaBurkina FasoBurundiCabo VerdeCambodiaCameroonCanadaCaribbean small statesCentral African RepublicCentral Europe and the BalticsChadChileChinaColombiaComorosCongo, Dem. Rep.Congo, Rep.Costa RicaCote d'IvoireCroatiaCubaCyprusCzech RepublicDenmarkDjiboutiDominicaDominican RepublicEarly-demographic dividendEast Asia & PacificEast Asia & Pacific (excluding high income)East Asia & Pacific (IDA & IBRD countries)EcuadorEgypt, Arab Rep.El SalvadorEquatorial GuineaEritreaEstoniaEthiopiaEuro areaEurope & Central AsiaEurope & Central Asia (excluding high income)Europe & Central Asia (IDA & IBRD countries)European UnionFaroe IslandsFijiFinlandFragile and conflict affected situationsFranceFrench PolynesiaGabonGambia, TheGeorgiaGermanyGhanaGreeceGreenlandGrenadaGuatemalaGuineaGuinea-BissauGuyanaHaitiHeavily indebted poor countries (HIPC)High incomeHondurasHong Kong SAR, ChinaHungaryIBRD onlyIcelandIDA & IBRD totalIDA blendIDA onlyIDA totalIndiaIndonesiaIran, Islamic Rep.IraqIrelandIsraelItalyJamaicaJapanJordanKazakhstanKenyaKiribatiKorea, Rep.KuwaitKyrgyz RepublicLao PDRLate-demographic dividendLatin America & Caribbean Latin America & Caribbean (excluding high income)Latin America & the Caribbean (IDA & IBRD countries)LatviaLeast developed countries: UN classificationLebanonLesothoLiberiaLibyaLiechtensteinLithuaniaLow & middle incomeLow incomeLower middle incomeLuxembourgMacao SAR, ChinaMacedonia, FYRMadagascarMalawiMalaysiaMaldivesMaliMaltaMarshall IslandsMauritaniaMauritiusMexicoMicronesia, Fed. Sts.Middle East & North AfricaMiddle East & North Africa (excluding high income)Middle East & North Africa (IDA & IBRD countries)Middle incomeMoldovaMongoliaMontenegroMoroccoMozambiqueNamibiaNepalNetherlandsNew CaledoniaNew ZealandNicaraguaNigerNigeriaNorth AmericaNorwayOECD membersOmanOther small statesPacific island small statesPakistanPalauPanamaPapua New GuineaParaguayPeruPhilippinesPolandPortugalPost-demographic dividendPre-demographic dividendQatarRomaniaRussian FederationRwandaSamoaSao Tome and PrincipeSaudi ArabiaSenegalSerbiaSeychellesSierra LeoneSingaporeSlovak RepublicSloveniaSmall statesSolomon IslandsSouth AfricaSouth AsiaSouth Asia (IDA & IBRD)SpainSri LankaSt. Kitts and NevisSt. LuciaSt. Vincent and the GrenadinesSub-Saharan Africa Sub-Saharan Africa (excluding high income)Sub-Saharan Africa (IDA & IBRD countries)SudanSurinameSwazilandSwedenSwitzerlandSyrian Arab RepublicTajikistanTanzaniaThailandTimor-LesteTogoTongaTrinidad and TobagoTunisiaTurkeyTurkmenistanUgandaUkraineUnited Arab EmiratesUnited KingdomUnited StatesUpper middle incomeUruguayUzbekistanVanuatuVenezuela, RBVietnamWest Bank and GazaWorldYemen, Rep.ZambiaZimbabwe La ligne de temps
Cette échelle de temps montre un graphique de 1974 année à 2015 année Bangladesh. Les données jusqu'à 1973 année ne sont pas présentés. Quantité d'observations actuelles selon dates: 42.
Source (désignation):
Les indicateurs du développement mondiale
Source (organisation):
World Bank staff estimates based on Samuel Fankhauser's "Valuing Climate Change: The Economics of the Greenhouse" (1995).
Catégories:
Economy & Growth, Environment
Dernière mise à jour
23 avr. 2017
Les indicateurs de changement de valeurs selon les années
Minimum:
0.049
1 janv. 1976
Maximum:
0.536
1 janv. 2007
Pour la date d''observation
Valeur
Changement absolu
Le changement par rapport à la valeur précédente
1 janv. 1974
0.09
+0.09
0.0%
1 janv. 1975
0.066
-0.024
-26.94%
1 janv. 1976
0.049
-0.017
-25.6%
1 janv. 1977
0.115
+0.066
134.85%
1 janv. 1978
0.135
+0.021
17.91%
1 janv. 1979
0.11
-0.025
-18.63%
1 janv. 1980
0.113
+0.003
3.11%
1 janv. 1981
0.127
+0.013
11.66%
1 janv. 1982
0.125
-0.002
-1.64%
1 janv. 1983
0.158
+0.034
27.27%
1 janv. 1984
0.166
+0.008
4.75%
1 janv. 1985
0.179
+0.013
8.12%
1 janv. 1986
0.181
+0.001
0.57%
1 janv. 1987
0.213
+0.032
17.97%
1 janv. 1988
0.204
-0.009
-4.13%
1 janv. 1989
0.223
+0.019
9.38%
1 janv. 1990
0.215
-0.008
-3.53%
1 janv. 1991
0.238
+0.023
10.55%
1 janv. 1992
0.26
+0.022
9.37%
1 janv. 1993
0.292
+0.032
12.17%
1 janv. 1994
0.283
-0.009
-3.15%
1 janv. 1995
0.312
+0.029
10.16%
1 janv. 1996
0.345
+0.033
10.65%
1 janv. 1997
0.307
-0.038
-10.97%
1 janv. 1998
0.316
+0.009
3.09%
1 janv. 1999
0.3
-0.017
-5.31%
1 janv. 2000
0.314
+0.015
4.89%
1 janv. 2001
0.344
+0.03
9.59%
1 janv. 2002
0.411
+0.067
19.37%
1 janv. 2003
0.429
+0.018
4.29%
1 janv. 2004
0.404
-0.024
-5.68%
1 janv. 2005
0.455
+0.05
12.37%
1 janv. 2006
0.42
-0.035
-7.65%
1 janv. 2007
0.536
+0.116
27.61%
1 janv. 2008
0.485
-0.051
-9.51%
1 janv. 2009
0.453
-0.031
-6.46%
1 janv. 2010
0.439
-0.015
-3.27%
1 janv. 2011
0.423
-0.015
-3.43%
1 janv. 2012
0.398
-0.025
-5.9%
1 janv. 2013
0.419
+0.021
5.17%
1 janv. 2014
0.407
-0.012
-2.96%
1 janv. 2015
0.389
-0.018
-4.44%
Classement des pays selon les statistiques actuelles par années


Commentaires: