29
/fr/
fr
AIzaSyAYiBZKx7MnpbEhh9jyipgxe19OcubqV5w
April 1, 2024
32356
Europe & Central Asia (IDA & IBRD countries)
TEC
false
2
1
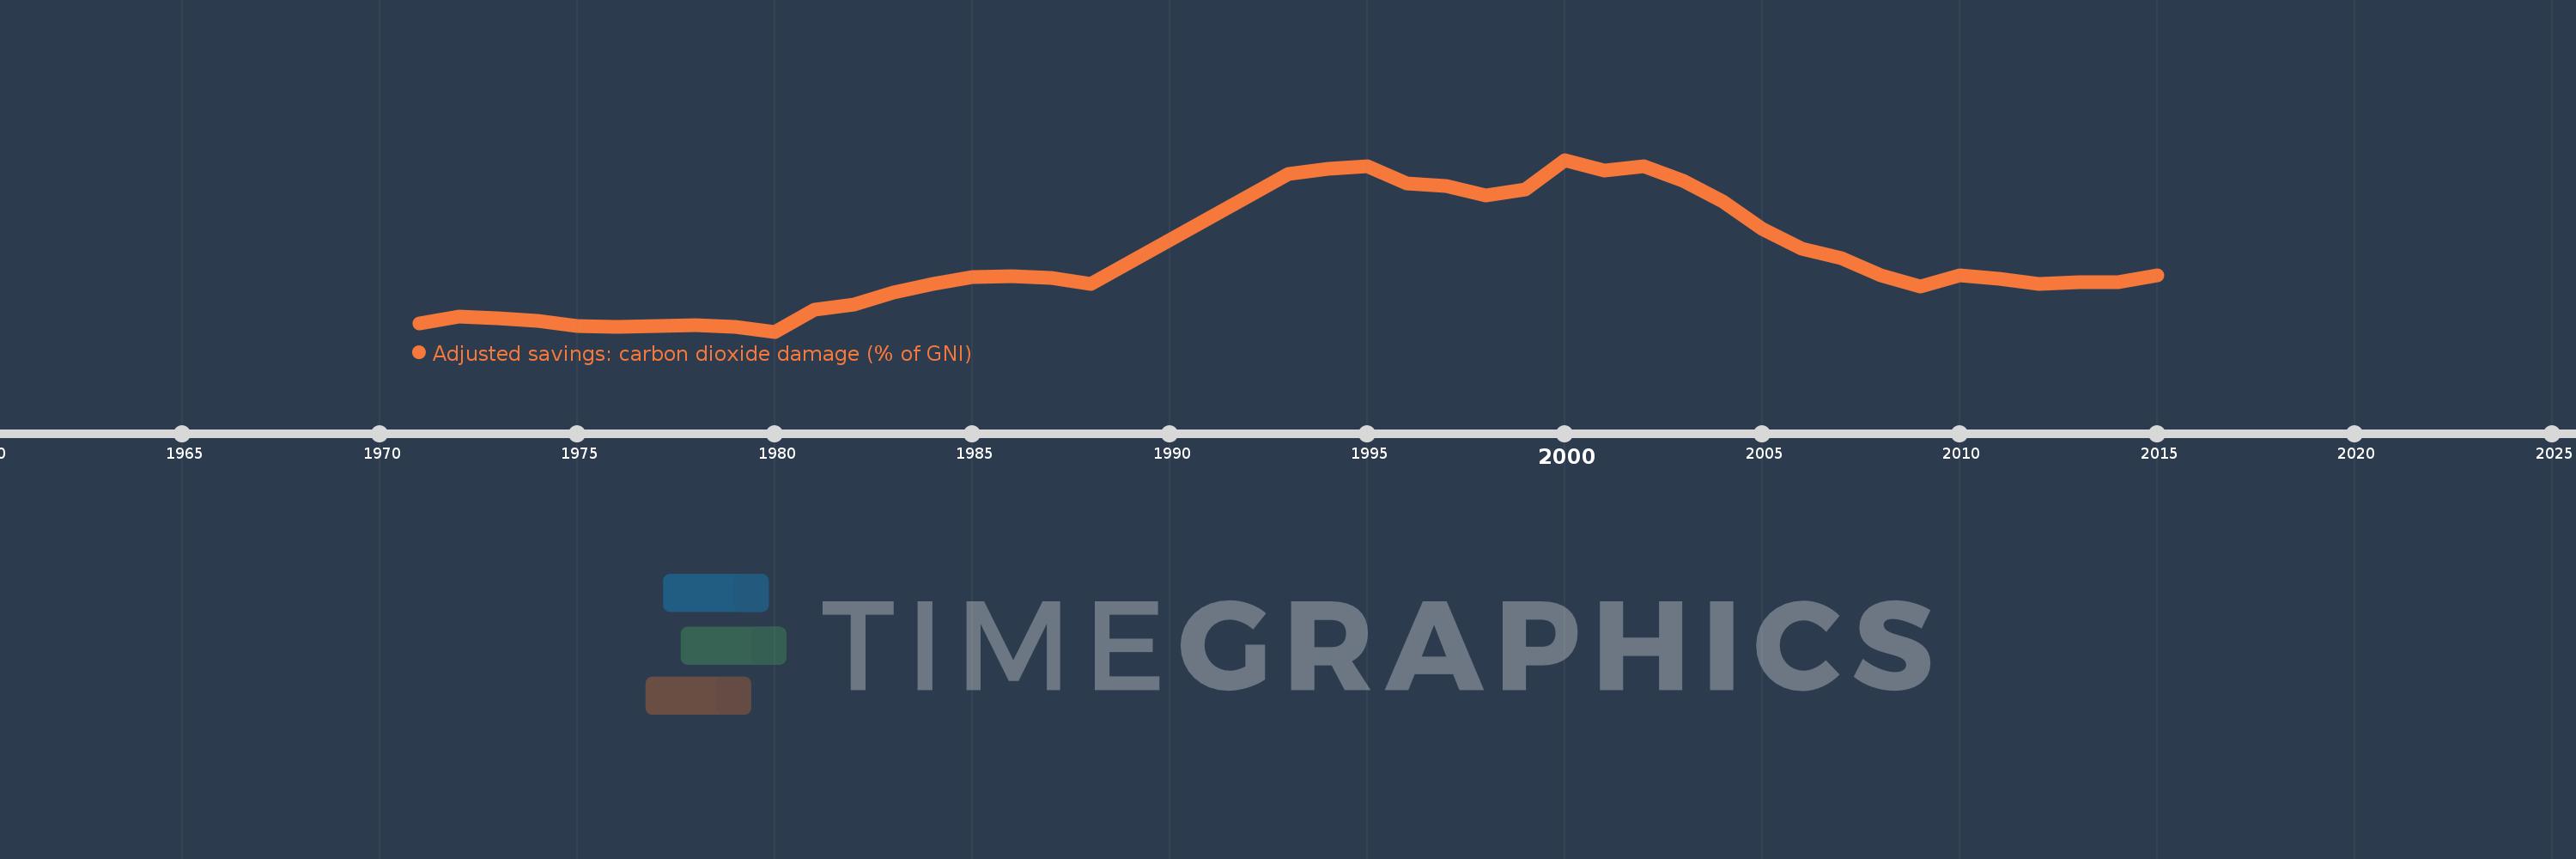
Adjusted savings: carbon dioxide damage (% of GNI)
2015,2014,2013,2012,2011,2010,2009,2008,2007,2006,2005,2004,2003,2002,2001,2000,1999,1998,1997,1996,1995,1994,1993,1988,1987,1986,1985,1984,1983,1982,1981,1980,1979,1978,1977,1976,1975,1974,1973,1972,1971
Cette statistique dans les autres pays:
AfghanistanAlbaniaAlgeriaAndorraAngolaAntigua and BarbudaArab WorldArgentinaArmeniaAustraliaAustriaAzerbaijanBahamas, TheBahrainBangladeshBarbadosBelarusBelgiumBelizeBeninBermudaBhutanBoliviaBosnia and HerzegovinaBotswanaBrazilBrunei DarussalamBulgariaBurkina FasoBurundiCabo VerdeCambodiaCameroonCanadaCaribbean small statesCentral African RepublicCentral Europe and the BalticsChadChileChinaColombiaComorosCongo, Dem. Rep.Congo, Rep.Costa RicaCote d'IvoireCroatiaCubaCyprusCzech RepublicDenmarkDjiboutiDominicaDominican RepublicEarly-demographic dividendEast Asia & PacificEast Asia & Pacific (excluding high income)East Asia & Pacific (IDA & IBRD countries)EcuadorEgypt, Arab Rep.El SalvadorEquatorial GuineaEritreaEstoniaEthiopiaEuro areaEurope & Central AsiaEurope & Central Asia (excluding high income)Europe & Central Asia (IDA & IBRD countries)European UnionFaroe IslandsFijiFinlandFragile and conflict affected situationsFranceFrench PolynesiaGabonGambia, TheGeorgiaGermanyGhanaGreeceGreenlandGrenadaGuatemalaGuineaGuinea-BissauGuyanaHaitiHeavily indebted poor countries (HIPC)High incomeHondurasHong Kong SAR, ChinaHungaryIBRD onlyIcelandIDA & IBRD totalIDA blendIDA onlyIDA totalIndiaIndonesiaIran, Islamic Rep.IraqIrelandIsraelItalyJamaicaJapanJordanKazakhstanKenyaKiribatiKorea, Rep.KuwaitKyrgyz RepublicLao PDRLate-demographic dividendLatin America & Caribbean Latin America & Caribbean (excluding high income)Latin America & the Caribbean (IDA & IBRD countries)LatviaLeast developed countries: UN classificationLebanonLesothoLiberiaLibyaLiechtensteinLithuaniaLow & middle incomeLow incomeLower middle incomeLuxembourgMacao SAR, ChinaMacedonia, FYRMadagascarMalawiMalaysiaMaldivesMaliMaltaMarshall IslandsMauritaniaMauritiusMexicoMicronesia, Fed. Sts.Middle East & North AfricaMiddle East & North Africa (excluding high income)Middle East & North Africa (IDA & IBRD countries)Middle incomeMoldovaMongoliaMontenegroMoroccoMozambiqueNamibiaNepalNetherlandsNew CaledoniaNew ZealandNicaraguaNigerNigeriaNorth AmericaNorwayOECD membersOmanOther small statesPacific island small statesPakistanPalauPanamaPapua New GuineaParaguayPeruPhilippinesPolandPortugalPost-demographic dividendPre-demographic dividendQatarRomaniaRussian FederationRwandaSamoaSao Tome and PrincipeSaudi ArabiaSenegalSerbiaSeychellesSierra LeoneSingaporeSlovak RepublicSloveniaSmall statesSolomon IslandsSouth AfricaSouth AsiaSouth Asia (IDA & IBRD)SpainSri LankaSt. Kitts and NevisSt. LuciaSt. Vincent and the GrenadinesSub-Saharan Africa Sub-Saharan Africa (excluding high income)Sub-Saharan Africa (IDA & IBRD countries)SudanSurinameSwazilandSwedenSwitzerlandSyrian Arab RepublicTajikistanTanzaniaThailandTimor-LesteTogoTongaTrinidad and TobagoTunisiaTurkeyTurkmenistanUgandaUkraineUnited Arab EmiratesUnited KingdomUnited StatesUpper middle incomeUruguayUzbekistanVanuatuVenezuela, RBVietnamWest Bank and GazaWorldYemen, Rep.ZambiaZimbabwe La ligne de temps
Cette échelle de temps montre un graphique de 1971 année à 2015 année Europe & Central Asia (IDA & IBRD countries). Les données jusqu'à 1970 année ne sont pas présentés. Quantité d'observations actuelles selon dates: 41.
Source (désignation):
Les indicateurs du développement mondiale
Source (organisation):
World Bank staff estimates based on Samuel Fankhauser's "Valuing Climate Change: The Economics of the Greenhouse" (1995).
Catégories:
Economy & Growth, Environment
Dernière mise à jour
23 avr. 2017
Les indicateurs de changement de valeurs selon les années
Minimum:
0.227
1 janv. 1980
Maximum:
2.478
1 janv. 2000
Pour la date d''observation
Valeur
Changement absolu
Le changement par rapport à la valeur précédente
1 janv. 1971
0.335
+0.335
0.0%
1 janv. 1972
0.419
+0.084
25.19%
1 janv. 1973
0.397
-0.022
-5.19%
1 janv. 1974
0.371
-0.026
-6.48%
1 janv. 1975
0.304
-0.067
-18.13%
1 janv. 1976
0.288
-0.017
-5.46%
1 janv. 1977
0.3
+0.013
4.39%
1 janv. 1978
0.312
+0.012
4.04%
1 janv. 1979
0.289
-0.023
-7.45%
1 janv. 1980
0.227
-0.062
-21.62%
1 janv. 1981
0.511
+0.285
125.61%
1 janv. 1982
0.577
+0.066
12.98%
1 janv. 1983
0.739
+0.161
27.94%
1 janv. 1984
0.851
+0.112
15.21%
1 janv. 1985
0.942
+0.091
10.66%
1 janv. 1986
0.953
+0.011
1.15%
1 janv. 1987
0.928
-0.024
-2.56%
1 janv. 1988
0.848
-0.08
-8.67%
1 janv. 1993
2.293
+1.445
170.45%
1 janv. 1994
2.364
+0.071
3.09%
1 janv. 1995
2.39
+0.026
1.1%
1 janv. 1996
2.163
-0.227
-9.52%
1 janv. 1997
2.134
-0.028
-1.3%
1 janv. 1998
2.006
-0.129
-6.02%
1 janv. 1999
2.085
+0.079
3.92%
1 janv. 2000
2.478
+0.394
18.88%
1 janv. 2001
2.339
-0.139
-5.62%
1 janv. 2002
2.393
+0.054
2.33%
1 janv. 2003
2.204
-0.189
-7.91%
1 janv. 2004
1.935
-0.269
-12.22%
1 janv. 2005
1.568
-0.367
-18.95%
1 janv. 2006
1.311
-0.257
-16.4%
1 janv. 2007
1.184
-0.127
-9.71%
1 janv. 2008
0.967
-0.216
-18.28%
1 janv. 2009
0.821
-0.146
-15.12%
1 janv. 2010
0.969
+0.148
18.04%
1 janv. 2011
0.922
-0.047
-4.88%
1 janv. 2012
0.847
-0.074
-8.07%
1 janv. 2013
0.873
+0.026
3.08%
1 janv. 2014
0.874
+0.001
0.06%
1 janv. 2015
0.964
+0.09
10.27%
Classement des pays selon les statistiques actuelles par années


Commentaires: