29
/fr/
fr
AIzaSyAYiBZKx7MnpbEhh9jyipgxe19OcubqV5w
April 1, 2024
110538
Congo, Rep.
COG
true
2
1
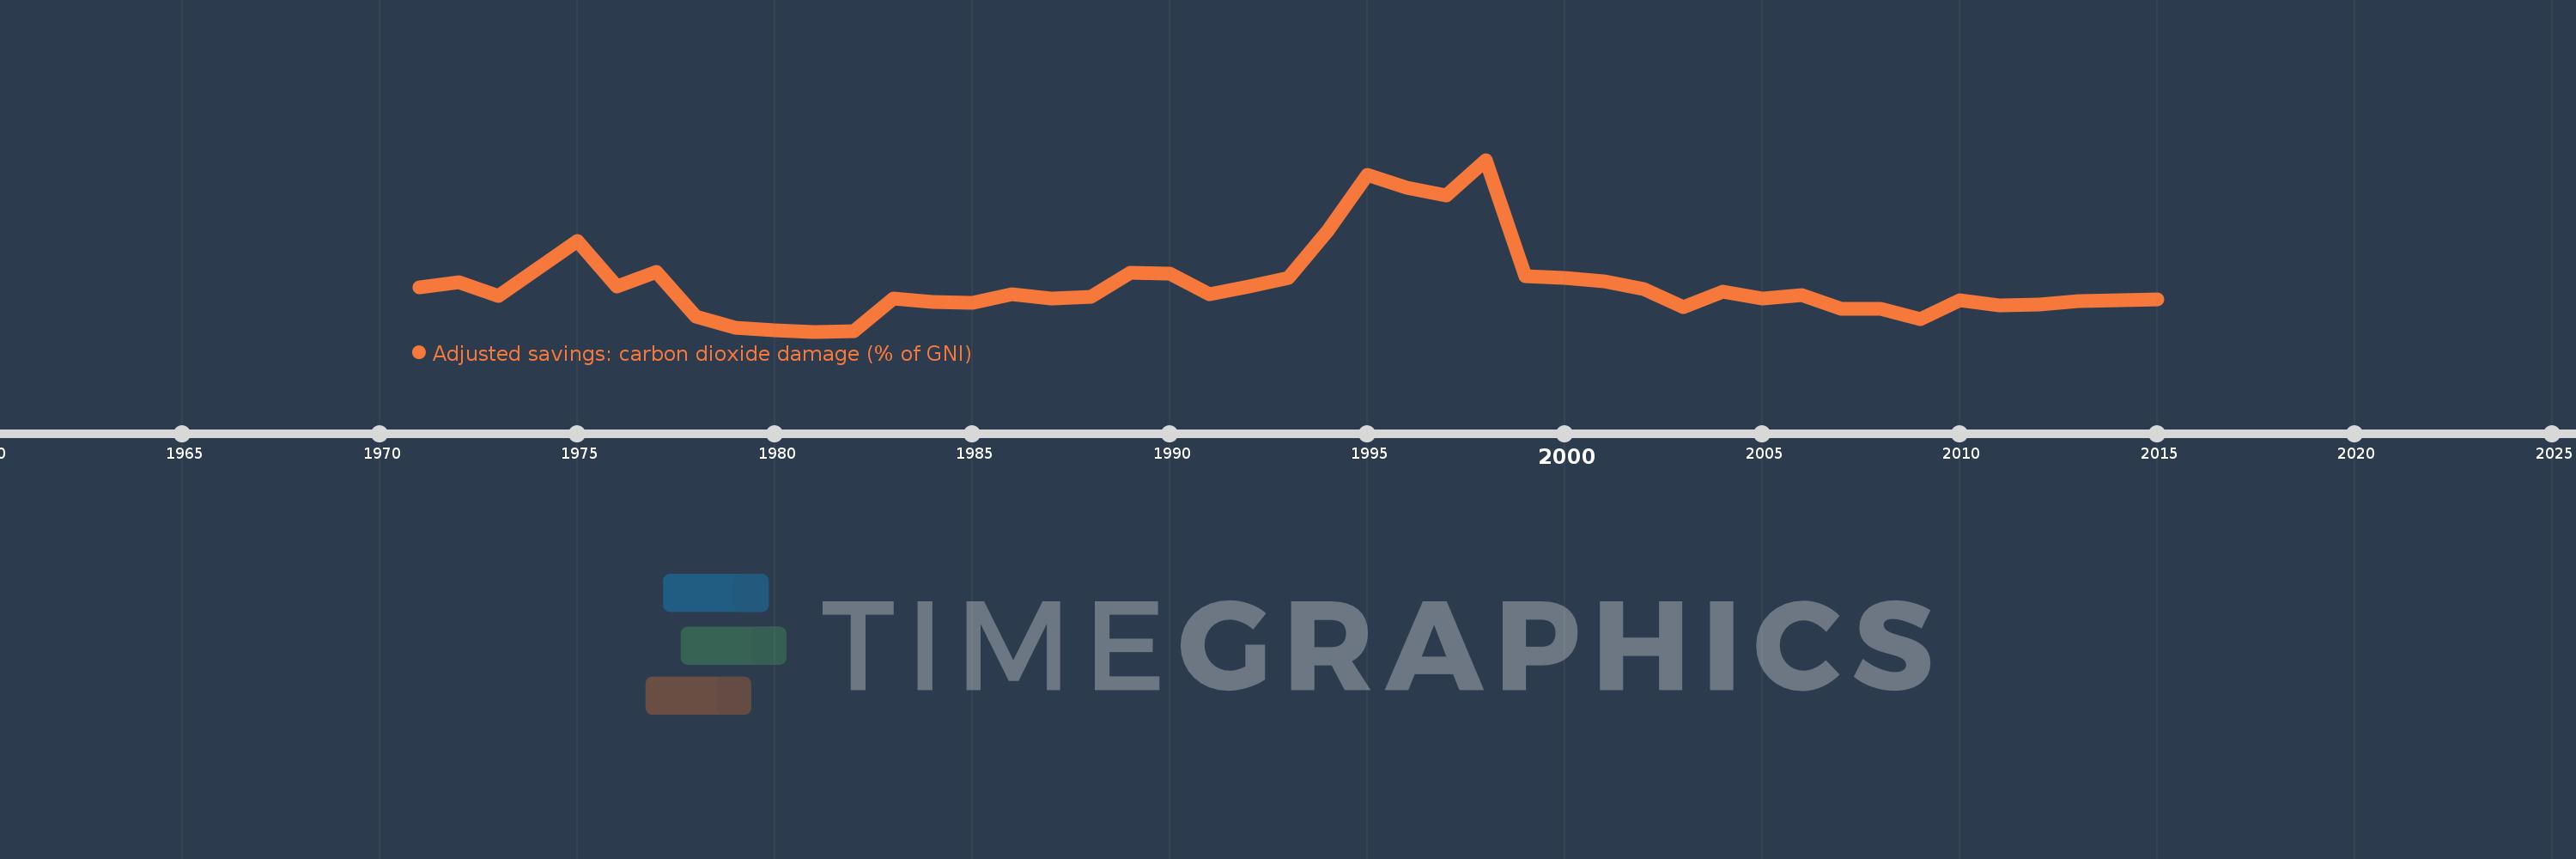
Adjusted savings: carbon dioxide damage (% of GNI)
2015,2014,2013,2012,2011,2010,2009,2008,2007,2006,2005,2004,2003,2002,2001,2000,1999,1998,1997,1996,1995,1994,1993,1992,1991,1990,1989,1988,1987,1986,1985,1984,1983,1982,1981,1980,1979,1978,1977,1976,1975,1974,1973,1972,1971
Cette statistique dans les autres pays:
AfghanistanAlbaniaAlgeriaAndorraAngolaAntigua and BarbudaArab WorldArgentinaArmeniaAustraliaAustriaAzerbaijanBahamas, TheBahrainBangladeshBarbadosBelarusBelgiumBelizeBeninBermudaBhutanBoliviaBosnia and HerzegovinaBotswanaBrazilBrunei DarussalamBulgariaBurkina FasoBurundiCabo VerdeCambodiaCameroonCanadaCaribbean small statesCentral African RepublicCentral Europe and the BalticsChadChileChinaColombiaComorosCongo, Dem. Rep.Congo, Rep.Costa RicaCote d'IvoireCroatiaCubaCyprusCzech RepublicDenmarkDjiboutiDominicaDominican RepublicEarly-demographic dividendEast Asia & PacificEast Asia & Pacific (excluding high income)East Asia & Pacific (IDA & IBRD countries)EcuadorEgypt, Arab Rep.El SalvadorEquatorial GuineaEritreaEstoniaEthiopiaEuro areaEurope & Central AsiaEurope & Central Asia (excluding high income)Europe & Central Asia (IDA & IBRD countries)European UnionFaroe IslandsFijiFinlandFragile and conflict affected situationsFranceFrench PolynesiaGabonGambia, TheGeorgiaGermanyGhanaGreeceGreenlandGrenadaGuatemalaGuineaGuinea-BissauGuyanaHaitiHeavily indebted poor countries (HIPC)High incomeHondurasHong Kong SAR, ChinaHungaryIBRD onlyIcelandIDA & IBRD totalIDA blendIDA onlyIDA totalIndiaIndonesiaIran, Islamic Rep.IraqIrelandIsraelItalyJamaicaJapanJordanKazakhstanKenyaKiribatiKorea, Rep.KuwaitKyrgyz RepublicLao PDRLate-demographic dividendLatin America & Caribbean Latin America & Caribbean (excluding high income)Latin America & the Caribbean (IDA & IBRD countries)LatviaLeast developed countries: UN classificationLebanonLesothoLiberiaLibyaLiechtensteinLithuaniaLow & middle incomeLow incomeLower middle incomeLuxembourgMacao SAR, ChinaMacedonia, FYRMadagascarMalawiMalaysiaMaldivesMaliMaltaMarshall IslandsMauritaniaMauritiusMexicoMicronesia, Fed. Sts.Middle East & North AfricaMiddle East & North Africa (excluding high income)Middle East & North Africa (IDA & IBRD countries)Middle incomeMoldovaMongoliaMontenegroMoroccoMozambiqueNamibiaNepalNetherlandsNew CaledoniaNew ZealandNicaraguaNigerNigeriaNorth AmericaNorwayOECD membersOmanOther small statesPacific island small statesPakistanPalauPanamaPapua New GuineaParaguayPeruPhilippinesPolandPortugalPost-demographic dividendPre-demographic dividendQatarRomaniaRussian FederationRwandaSamoaSao Tome and PrincipeSaudi ArabiaSenegalSerbiaSeychellesSierra LeoneSingaporeSlovak RepublicSloveniaSmall statesSolomon IslandsSouth AfricaSouth AsiaSouth Asia (IDA & IBRD)SpainSri LankaSt. Kitts and NevisSt. LuciaSt. Vincent and the GrenadinesSub-Saharan Africa Sub-Saharan Africa (excluding high income)Sub-Saharan Africa (IDA & IBRD countries)SudanSurinameSwazilandSwedenSwitzerlandSyrian Arab RepublicTajikistanTanzaniaThailandTimor-LesteTogoTongaTrinidad and TobagoTunisiaTurkeyTurkmenistanUgandaUkraineUnited Arab EmiratesUnited KingdomUnited StatesUpper middle incomeUruguayUzbekistanVanuatuVenezuela, RBVietnamWest Bank and GazaWorldYemen, Rep.ZambiaZimbabwe La ligne de temps
Cette échelle de temps montre un graphique de 1971 année à 2015 année Congo, Rep.. Les données jusqu'à 1970 année ne sont pas présentés. Quantité d'observations actuelles selon dates: 45.
Source (désignation):
Les indicateurs du développement mondiale
Source (organisation):
World Bank staff estimates based on Samuel Fankhauser's "Valuing Climate Change: The Economics of the Greenhouse" (1995).
Catégories:
Economy & Growth, Environment
Dernière mise à jour
23 avr. 2017
Les indicateurs de changement de valeurs selon les années
Minimum:
0.077
1 janv. 1981
Maximum:
0.884
1 janv. 1998
Pour la date d''observation
Valeur
Changement absolu
Le changement par rapport à la valeur précédente
1 janv. 1971
0.285
+0.285
0.0%
1 janv. 1972
0.309
+0.024
8.45%
1 janv. 1973
0.246
-0.063
-20.38%
1 janv. 1974
0.374
+0.128
52.12%
1 janv. 1975
0.503
+0.129
34.38%
1 janv. 1976
0.29
-0.212
-42.22%
1 janv. 1977
0.358
+0.068
23.31%
1 janv. 1978
0.147
-0.211
-58.81%
1 janv. 1979
0.095
-0.053
-35.79%
1 janv. 1980
0.083
-0.011
-11.87%
1 janv. 1981
0.077
-0.006
-7.71%
1 janv. 1982
0.081
+0.004
5.52%
1 janv. 1983
0.231
+0.15
184.39%
1 janv. 1984
0.217
-0.014
-6.0%
1 janv. 1985
0.211
-0.006
-2.81%
1 janv. 1986
0.253
+0.041
19.63%
1 janv. 1987
0.234
-0.019
-7.39%
1 janv. 1988
0.242
+0.009
3.64%
1 janv. 1989
0.352
+0.11
45.35%
1 janv. 1990
0.35
-0.002
-0.65%
1 janv. 1991
0.253
-0.098
-27.85%
1 janv. 1992
0.287
+0.034
13.51%
1 janv. 1993
0.329
+0.042
14.75%
1 janv. 1994
0.553
+0.224
68.06%
1 janv. 1995
0.812
+0.259
46.79%
1 janv. 1996
0.753
-0.058
-7.2%
1 janv. 1997
0.718
-0.035
-4.69%
1 janv. 1998
0.884
+0.166
23.08%
1 janv. 1999
0.337
-0.547
-61.88%
1 janv. 2000
0.329
-0.008
-2.44%
1 janv. 2001
0.314
-0.015
-4.48%
1 janv. 2002
0.275
-0.039
-12.56%
1 janv. 2003
0.192
-0.083
-30.13%
1 janv. 2004
0.266
+0.074
38.51%
1 janv. 2005
0.233
-0.032
-12.18%
1 janv. 2006
0.249
+0.016
6.79%
1 janv. 2007
0.185
-0.064
-25.77%
1 janv. 2008
0.184
-0.001
-0.46%
1 janv. 2009
0.135
-0.049
-26.82%
1 janv. 2010
0.224
+0.09
66.62%
1 janv. 2011
0.2
-0.024
-10.69%
1 janv. 2012
0.203
+0.003
1.44%
1 janv. 2013
0.221
+0.017
8.51%
1 janv. 2014
0.223
+0.003
1.21%
1 janv. 2015
0.23
+0.007
3.05%
Classement des pays selon les statistiques actuelles par années


Commentaires: