29
/fr/
fr
AIzaSyAYiBZKx7MnpbEhh9jyipgxe19OcubqV5w
April 1, 2024
42062
Latin America & Caribbean (excluding high income)
LAC
false
2
1
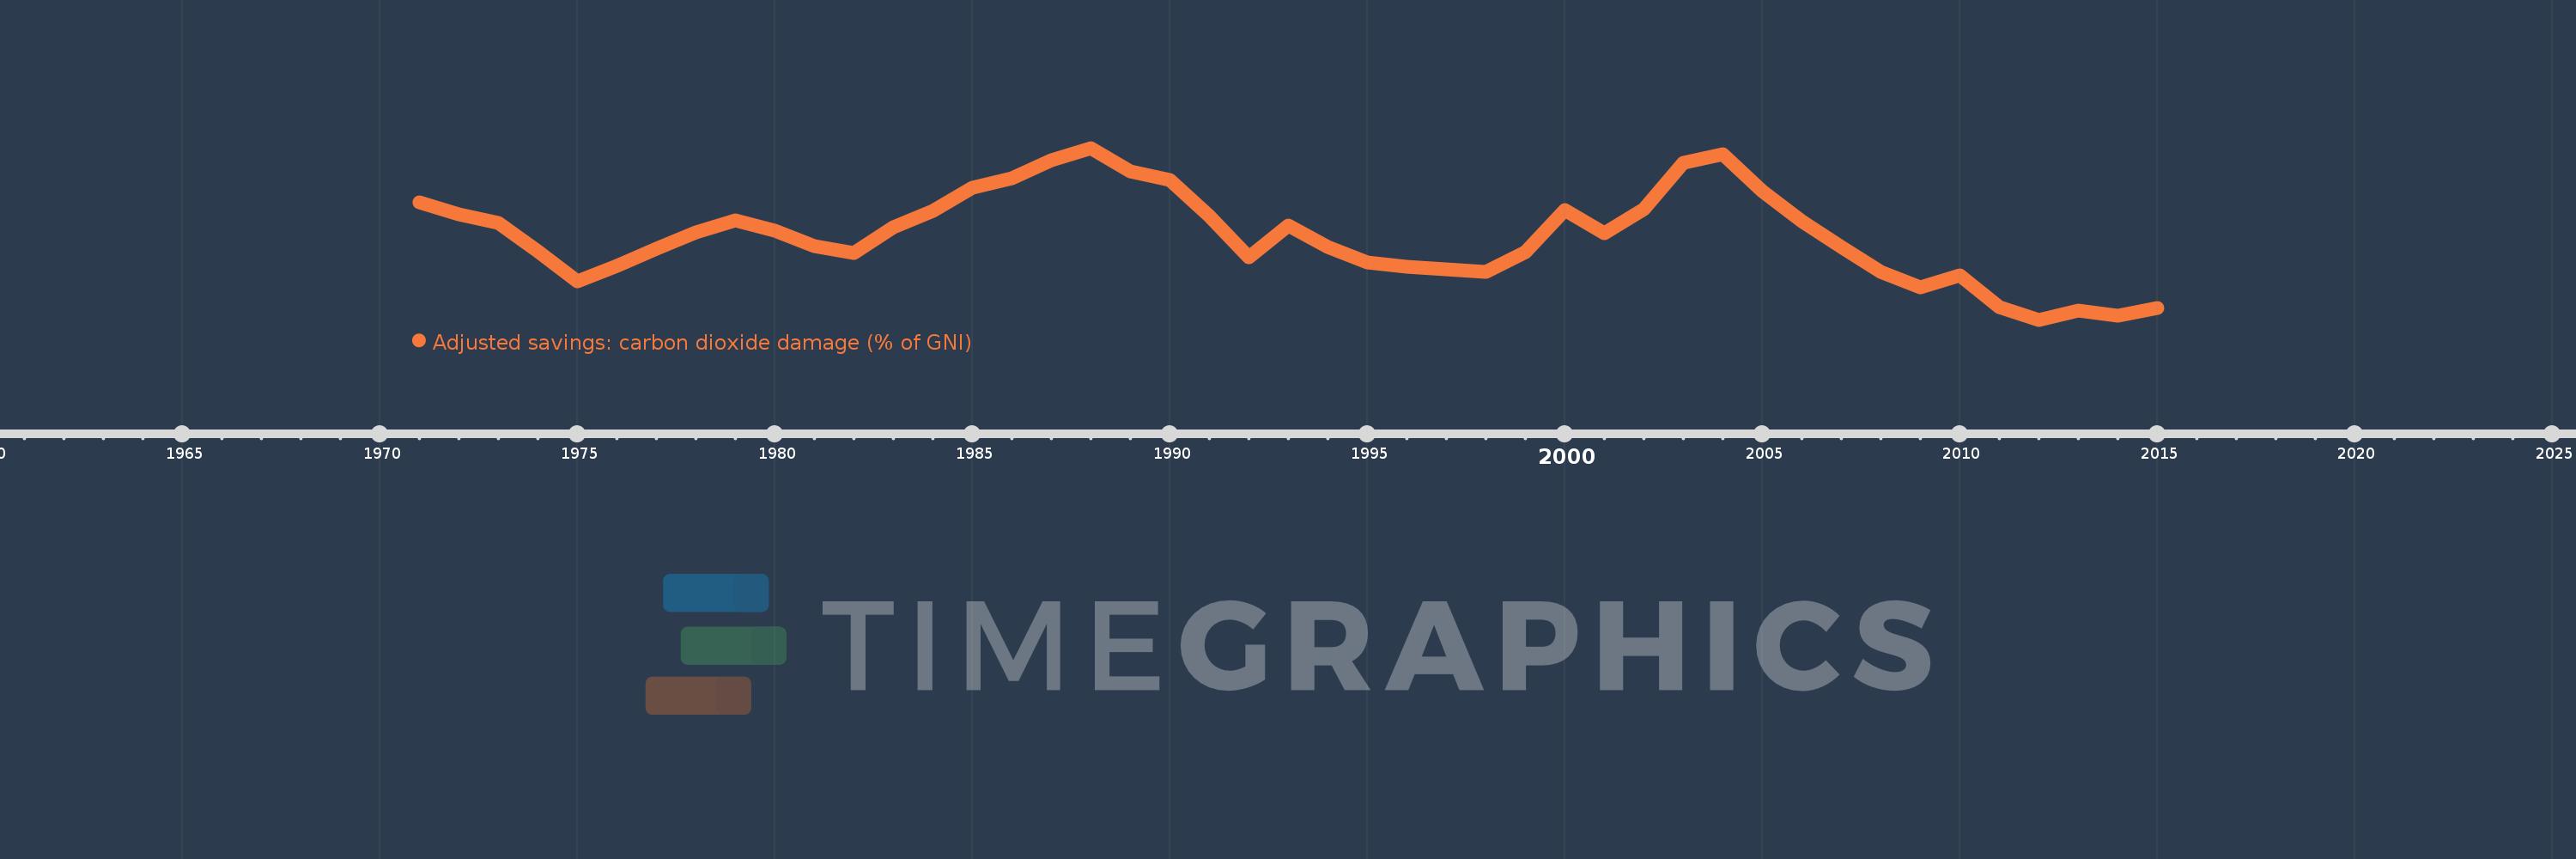
Adjusted savings: carbon dioxide damage (% of GNI)
2015,2014,2013,2012,2011,2010,2009,2008,2007,2006,2005,2004,2003,2002,2001,2000,1999,1998,1997,1996,1995,1994,1993,1992,1991,1990,1989,1988,1987,1986,1985,1984,1983,1982,1981,1980,1979,1978,1977,1976,1975,1974,1973,1972,1971
Cette statistique dans les autres pays:
AfghanistanAlbaniaAlgeriaAndorraAngolaAntigua and BarbudaArab WorldArgentinaArmeniaAustraliaAustriaAzerbaijanBahamas, TheBahrainBangladeshBarbadosBelarusBelgiumBelizeBeninBermudaBhutanBoliviaBosnia and HerzegovinaBotswanaBrazilBrunei DarussalamBulgariaBurkina FasoBurundiCabo VerdeCambodiaCameroonCanadaCaribbean small statesCentral African RepublicCentral Europe and the BalticsChadChileChinaColombiaComorosCongo, Dem. Rep.Congo, Rep.Costa RicaCote d'IvoireCroatiaCubaCyprusCzech RepublicDenmarkDjiboutiDominicaDominican RepublicEarly-demographic dividendEast Asia & PacificEast Asia & Pacific (excluding high income)East Asia & Pacific (IDA & IBRD countries)EcuadorEgypt, Arab Rep.El SalvadorEquatorial GuineaEritreaEstoniaEthiopiaEuro areaEurope & Central AsiaEurope & Central Asia (excluding high income)Europe & Central Asia (IDA & IBRD countries)European UnionFaroe IslandsFijiFinlandFragile and conflict affected situationsFranceFrench PolynesiaGabonGambia, TheGeorgiaGermanyGhanaGreeceGreenlandGrenadaGuatemalaGuineaGuinea-BissauGuyanaHaitiHeavily indebted poor countries (HIPC)High incomeHondurasHong Kong SAR, ChinaHungaryIBRD onlyIcelandIDA & IBRD totalIDA blendIDA onlyIDA totalIndiaIndonesiaIran, Islamic Rep.IraqIrelandIsraelItalyJamaicaJapanJordanKazakhstanKenyaKiribatiKorea, Rep.KuwaitKyrgyz RepublicLao PDRLate-demographic dividendLatin America & Caribbean Latin America & Caribbean (excluding high income)Latin America & the Caribbean (IDA & IBRD countries)LatviaLeast developed countries: UN classificationLebanonLesothoLiberiaLibyaLiechtensteinLithuaniaLow & middle incomeLow incomeLower middle incomeLuxembourgMacao SAR, ChinaMacedonia, FYRMadagascarMalawiMalaysiaMaldivesMaliMaltaMarshall IslandsMauritaniaMauritiusMexicoMicronesia, Fed. Sts.Middle East & North AfricaMiddle East & North Africa (excluding high income)Middle East & North Africa (IDA & IBRD countries)Middle incomeMoldovaMongoliaMontenegroMoroccoMozambiqueNamibiaNepalNetherlandsNew CaledoniaNew ZealandNicaraguaNigerNigeriaNorth AmericaNorwayOECD membersOmanOther small statesPacific island small statesPakistanPalauPanamaPapua New GuineaParaguayPeruPhilippinesPolandPortugalPost-demographic dividendPre-demographic dividendQatarRomaniaRussian FederationRwandaSamoaSao Tome and PrincipeSaudi ArabiaSenegalSerbiaSeychellesSierra LeoneSingaporeSlovak RepublicSloveniaSmall statesSolomon IslandsSouth AfricaSouth AsiaSouth Asia (IDA & IBRD)SpainSri LankaSt. Kitts and NevisSt. LuciaSt. Vincent and the GrenadinesSub-Saharan Africa Sub-Saharan Africa (excluding high income)Sub-Saharan Africa (IDA & IBRD countries)SudanSurinameSwazilandSwedenSwitzerlandSyrian Arab RepublicTajikistanTanzaniaThailandTimor-LesteTogoTongaTrinidad and TobagoTunisiaTurkeyTurkmenistanUgandaUkraineUnited Arab EmiratesUnited KingdomUnited StatesUpper middle incomeUruguayUzbekistanVanuatuVenezuela, RBVietnamWest Bank and GazaWorldYemen, Rep.ZambiaZimbabwe La ligne de temps
Cette échelle de temps montre un graphique de 1971 année à 2015 année Latin America & Caribbean (excluding high income). Les données jusqu'à 1970 année ne sont pas présentés. Quantité d'observations actuelles selon dates: 45.
Source (désignation):
Les indicateurs du développement mondiale
Source (organisation):
World Bank staff estimates based on Samuel Fankhauser's "Valuing Climate Change: The Economics of the Greenhouse" (1995).
Catégories:
Economy & Growth, Environment
Dernière mise à jour
23 avr. 2017
Les indicateurs de changement de valeurs selon les années
Maximum:
0.551
1 janv. 1988
Pour la date d''observation
Valeur
Changement absolu
Le changement par rapport à la valeur précédente
1 janv. 1971
0.465
+0.465
0.0%
1 janv. 1972
0.446
-0.019
-4.0%
1 janv. 1973
0.433
-0.013
-3.0%
1 janv. 1974
0.388
-0.046
-10.51%
1 janv. 1975
0.34
-0.048
-12.26%
1 janv. 1976
0.365
+0.025
7.32%
1 janv. 1977
0.392
+0.027
7.38%
1 janv. 1978
0.418
+0.026
6.73%
1 janv. 1979
0.437
+0.019
4.48%
1 janv. 1980
0.421
-0.016
-3.64%
1 janv. 1981
0.396
-0.025
-5.93%
1 janv. 1982
0.385
-0.011
-2.67%
1 janv. 1983
0.426
+0.04
10.39%
1 janv. 1984
0.452
+0.027
6.25%
1 janv. 1985
0.488
+0.035
7.85%
1 janv. 1986
0.503
+0.016
3.23%
1 janv. 1987
0.531
+0.028
5.49%
1 janv. 1988
0.551
+0.02
3.77%
1 janv. 1989
0.514
-0.037
-6.77%
1 janv. 1990
0.501
-0.013
-2.5%
1 janv. 1991
0.444
-0.057
-11.38%
1 janv. 1992
0.379
-0.065
-14.54%
1 janv. 1993
0.428
+0.049
12.88%
1 janv. 1994
0.395
-0.033
-7.82%
1 janv. 1995
0.371
-0.023
-5.88%
1 janv. 1996
0.364
-0.008
-2.09%
1 janv. 1997
0.36
-0.003
-0.94%
1 janv. 1998
0.356
-0.004
-1.08%
1 janv. 1999
0.387
+0.031
8.63%
1 janv. 2000
0.453
+0.065
16.89%
1 janv. 2001
0.416
-0.036
-8.0%
1 janv. 2002
0.455
+0.039
9.28%
1 janv. 2003
0.528
+0.073
16.07%
1 janv. 2004
0.541
+0.012
2.35%
1 janv. 2005
0.483
-0.057
-10.58%
1 janv. 2006
0.436
-0.047
-9.81%
1 janv. 2007
0.395
-0.041
-9.31%
1 janv. 2008
0.355
-0.04
-10.18%
1 janv. 2009
0.331
-0.025
-6.93%
1 janv. 2010
0.35
+0.019
5.83%
1 janv. 2011
0.3
-0.05
-14.16%
1 janv. 2012
0.28
-0.02
-6.62%
1 janv. 2013
0.294
+0.014
4.94%
1 janv. 2014
0.286
-0.008
-2.82%
1 janv. 2015
0.298
+0.012
4.33%
Classement des pays selon les statistiques actuelles par années


Commentaires: