29
/fr/
fr
AIzaSyAYiBZKx7MnpbEhh9jyipgxe19OcubqV5w
April 1, 2024
153247
Iceland
ISL
true
2
1
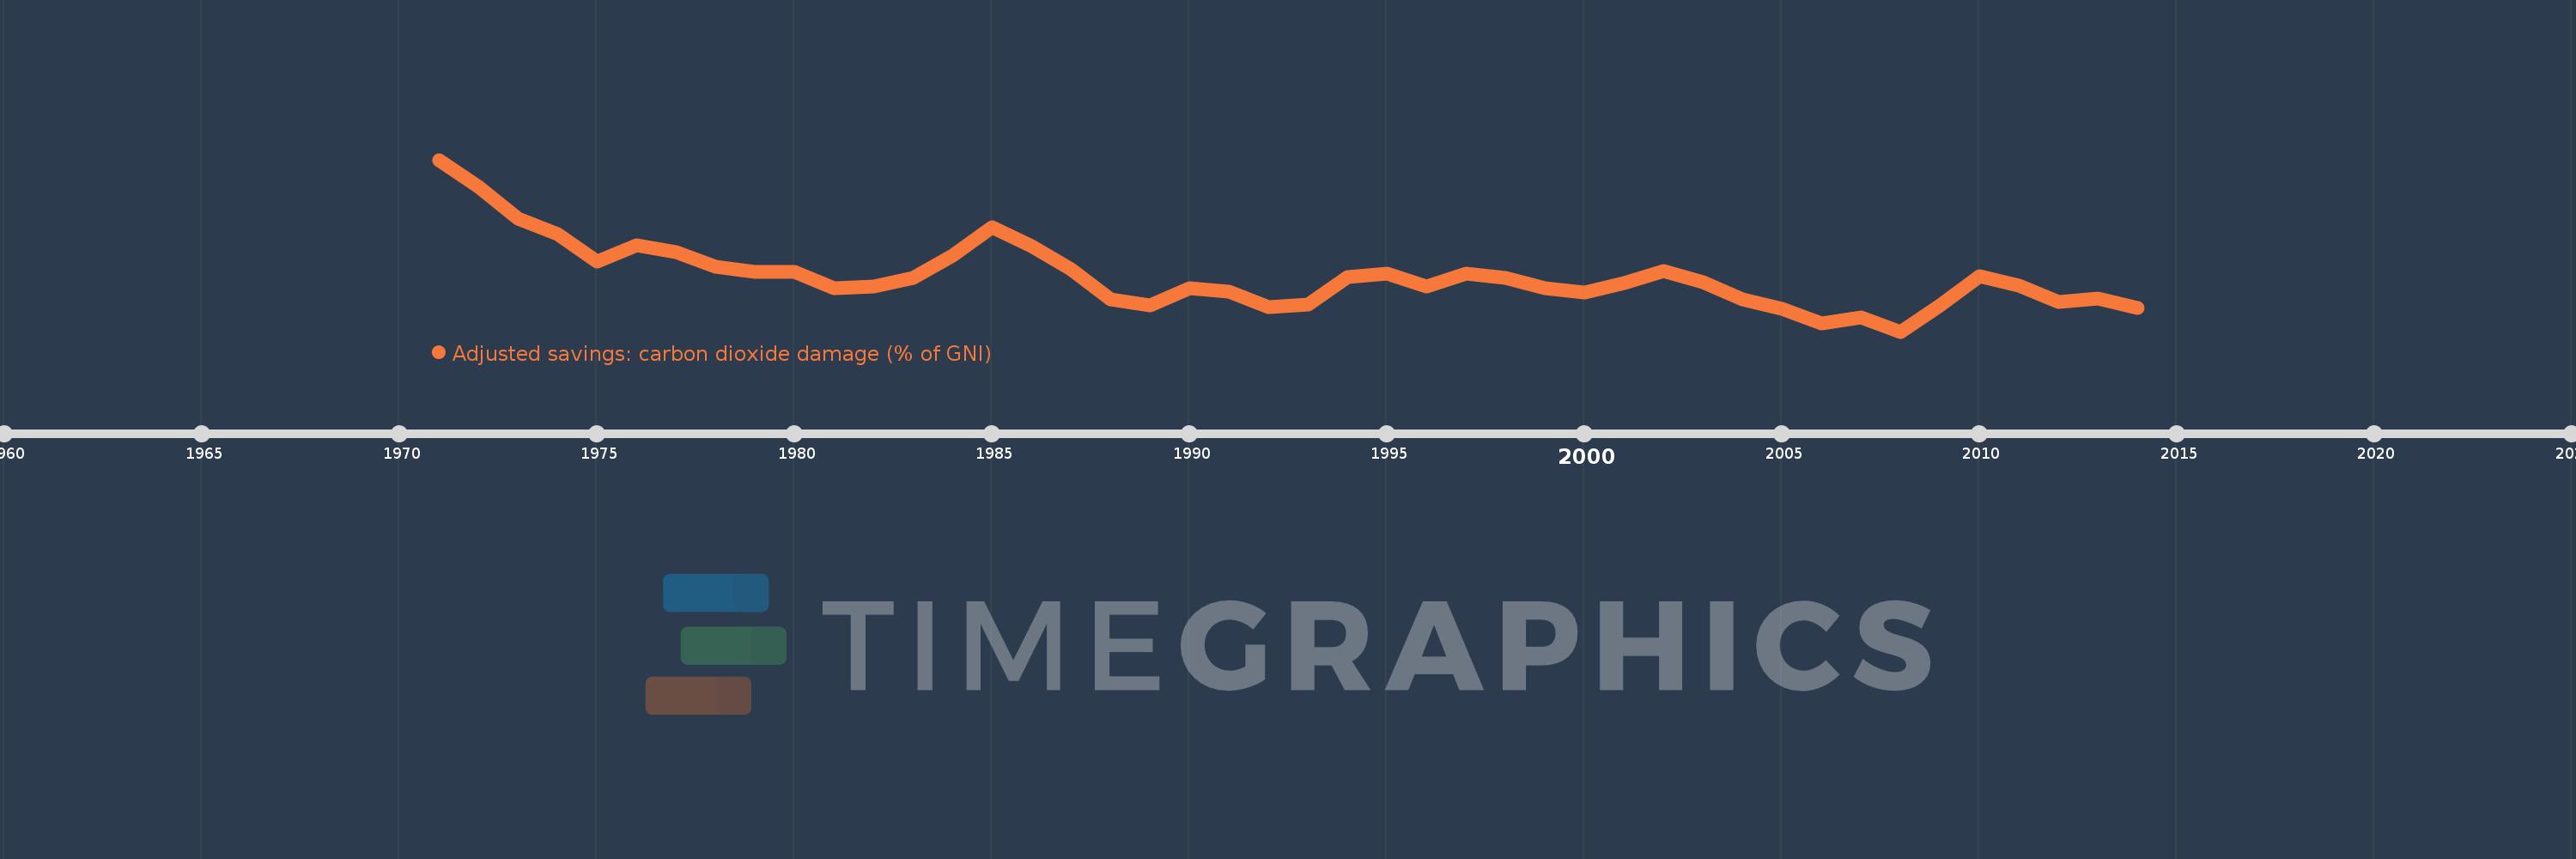
Adjusted savings: carbon dioxide damage (% of GNI)
2014,2013,2012,2011,2010,2009,2008,2007,2006,2005,2004,2003,2002,2001,2000,1999,1998,1997,1996,1995,1994,1993,1992,1991,1990,1989,1988,1987,1986,1985,1984,1983,1982,1981,1980,1979,1978,1977,1976,1975,1974,1973,1972,1971
Cette statistique dans les autres pays:
AfghanistanAlbaniaAlgeriaAndorraAngolaAntigua and BarbudaArab WorldArgentinaArmeniaAustraliaAustriaAzerbaijanBahamas, TheBahrainBangladeshBarbadosBelarusBelgiumBelizeBeninBermudaBhutanBoliviaBosnia and HerzegovinaBotswanaBrazilBrunei DarussalamBulgariaBurkina FasoBurundiCabo VerdeCambodiaCameroonCanadaCaribbean small statesCentral African RepublicCentral Europe and the BalticsChadChileChinaColombiaComorosCongo, Dem. Rep.Congo, Rep.Costa RicaCote d'IvoireCroatiaCubaCyprusCzech RepublicDenmarkDjiboutiDominicaDominican RepublicEarly-demographic dividendEast Asia & PacificEast Asia & Pacific (excluding high income)East Asia & Pacific (IDA & IBRD countries)EcuadorEgypt, Arab Rep.El SalvadorEquatorial GuineaEritreaEstoniaEthiopiaEuro areaEurope & Central AsiaEurope & Central Asia (excluding high income)Europe & Central Asia (IDA & IBRD countries)European UnionFaroe IslandsFijiFinlandFragile and conflict affected situationsFranceFrench PolynesiaGabonGambia, TheGeorgiaGermanyGhanaGreeceGreenlandGrenadaGuatemalaGuineaGuinea-BissauGuyanaHaitiHeavily indebted poor countries (HIPC)High incomeHondurasHong Kong SAR, ChinaHungaryIBRD onlyIcelandIDA & IBRD totalIDA blendIDA onlyIDA totalIndiaIndonesiaIran, Islamic Rep.IraqIrelandIsraelItalyJamaicaJapanJordanKazakhstanKenyaKiribatiKorea, Rep.KuwaitKyrgyz RepublicLao PDRLate-demographic dividendLatin America & Caribbean Latin America & Caribbean (excluding high income)Latin America & the Caribbean (IDA & IBRD countries)LatviaLeast developed countries: UN classificationLebanonLesothoLiberiaLibyaLiechtensteinLithuaniaLow & middle incomeLow incomeLower middle incomeLuxembourgMacao SAR, ChinaMacedonia, FYRMadagascarMalawiMalaysiaMaldivesMaliMaltaMarshall IslandsMauritaniaMauritiusMexicoMicronesia, Fed. Sts.Middle East & North AfricaMiddle East & North Africa (excluding high income)Middle East & North Africa (IDA & IBRD countries)Middle incomeMoldovaMongoliaMontenegroMoroccoMozambiqueNamibiaNepalNetherlandsNew CaledoniaNew ZealandNicaraguaNigerNigeriaNorth AmericaNorwayOECD membersOmanOther small statesPacific island small statesPakistanPalauPanamaPapua New GuineaParaguayPeruPhilippinesPolandPortugalPost-demographic dividendPre-demographic dividendQatarRomaniaRussian FederationRwandaSamoaSao Tome and PrincipeSaudi ArabiaSenegalSerbiaSeychellesSierra LeoneSingaporeSlovak RepublicSloveniaSmall statesSolomon IslandsSouth AfricaSouth AsiaSouth Asia (IDA & IBRD)SpainSri LankaSt. Kitts and NevisSt. LuciaSt. Vincent and the GrenadinesSub-Saharan Africa Sub-Saharan Africa (excluding high income)Sub-Saharan Africa (IDA & IBRD countries)SudanSurinameSwazilandSwedenSwitzerlandSyrian Arab RepublicTajikistanTanzaniaThailandTimor-LesteTogoTongaTrinidad and TobagoTunisiaTurkeyTurkmenistanUgandaUkraineUnited Arab EmiratesUnited KingdomUnited StatesUpper middle incomeUruguayUzbekistanVanuatuVenezuela, RBVietnamWest Bank and GazaWorldYemen, Rep.ZambiaZimbabwe La ligne de temps
Cette échelle de temps montre un graphique de 1971 année à 2014 année Iceland. Les données jusqu'à 1970 année ne sont pas présentés. Quantité d'observations actuelles selon dates: 44.
Source (désignation):
Les indicateurs du développement mondiale
Source (organisation):
World Bank staff estimates based on Samuel Fankhauser's "Valuing Climate Change: The Economics of the Greenhouse" (1995).
Catégories:
Economy & Growth, Environment
Dernière mise à jour
23 avr. 2017
Les indicateurs de changement de valeurs selon les années
Minimum:
0.099
1 janv. 2008
Maximum:
0.351
1 janv. 1971
Pour la date d''observation
Valeur
Changement absolu
Le changement par rapport à la valeur précédente
1 janv. 1971
0.351
+0.351
0.0%
1 janv. 1972
0.311
-0.041
-11.55%
1 janv. 1973
0.265
-0.046
-14.81%
1 janv. 1974
0.242
-0.022
-8.49%
1 janv. 1975
0.202
-0.04
-16.4%
1 janv. 1976
0.226
+0.024
11.69%
1 janv. 1977
0.215
-0.011
-5.02%
1 janv. 1978
0.194
-0.02
-9.54%
1 janv. 1979
0.187
-0.007
-3.52%
1 janv. 1980
0.187
-0.001
-0.39%
1 janv. 1981
0.163
-0.023
-12.49%
1 janv. 1982
0.165
+0.002
1.26%
1 janv. 1983
0.178
+0.012
7.4%
1 janv. 1984
0.211
+0.034
18.93%
1 janv. 1985
0.252
+0.041
19.37%
1 janv. 1986
0.225
-0.027
-10.62%
1 janv. 1987
0.19
-0.036
-15.9%
1 janv. 1988
0.146
-0.044
-23.05%
1 janv. 1989
0.138
-0.008
-5.3%
1 janv. 1990
0.163
+0.024
17.73%
1 janv. 1991
0.157
-0.006
-3.55%
1 janv. 1992
0.135
-0.022
-14.07%
1 janv. 1993
0.139
+0.005
3.5%
1 janv. 1994
0.179
+0.04
28.41%
1 janv. 1995
0.184
+0.005
2.95%
1 janv. 1996
0.165
-0.019
-10.49%
1 janv. 1997
0.184
+0.019
11.42%
1 janv. 1998
0.178
-0.006
-3.28%
1 janv. 1999
0.163
-0.015
-8.42%
1 janv. 2000
0.156
-0.007
-4.35%
1 janv. 2001
0.17
+0.014
9.17%
1 janv. 2002
0.188
+0.018
10.39%
1 janv. 2003
0.172
-0.016
-8.56%
1 janv. 2004
0.146
-0.026
-15.27%
1 janv. 2005
0.132
-0.013
-9.21%
1 janv. 2006
0.111
-0.021
-16.14%
1 janv. 2007
0.12
+0.009
8.21%
1 janv. 2008
0.099
-0.021
-17.18%
1 janv. 2009
0.137
+0.037
37.64%
1 janv. 2010
0.18
+0.043
31.77%
1 janv. 2011
0.166
-0.014
-7.86%
1 janv. 2012
0.142
-0.024
-14.18%
1 janv. 2013
0.148
+0.006
4.05%
1 janv. 2014
0.134
-0.014
-9.29%
Classement des pays selon les statistiques actuelles par années


Commentaires: