29
/fr/
fr
AIzaSyAYiBZKx7MnpbEhh9jyipgxe19OcubqV5w
April 1, 2024
76836
Bahrain
BHR
true
2
1
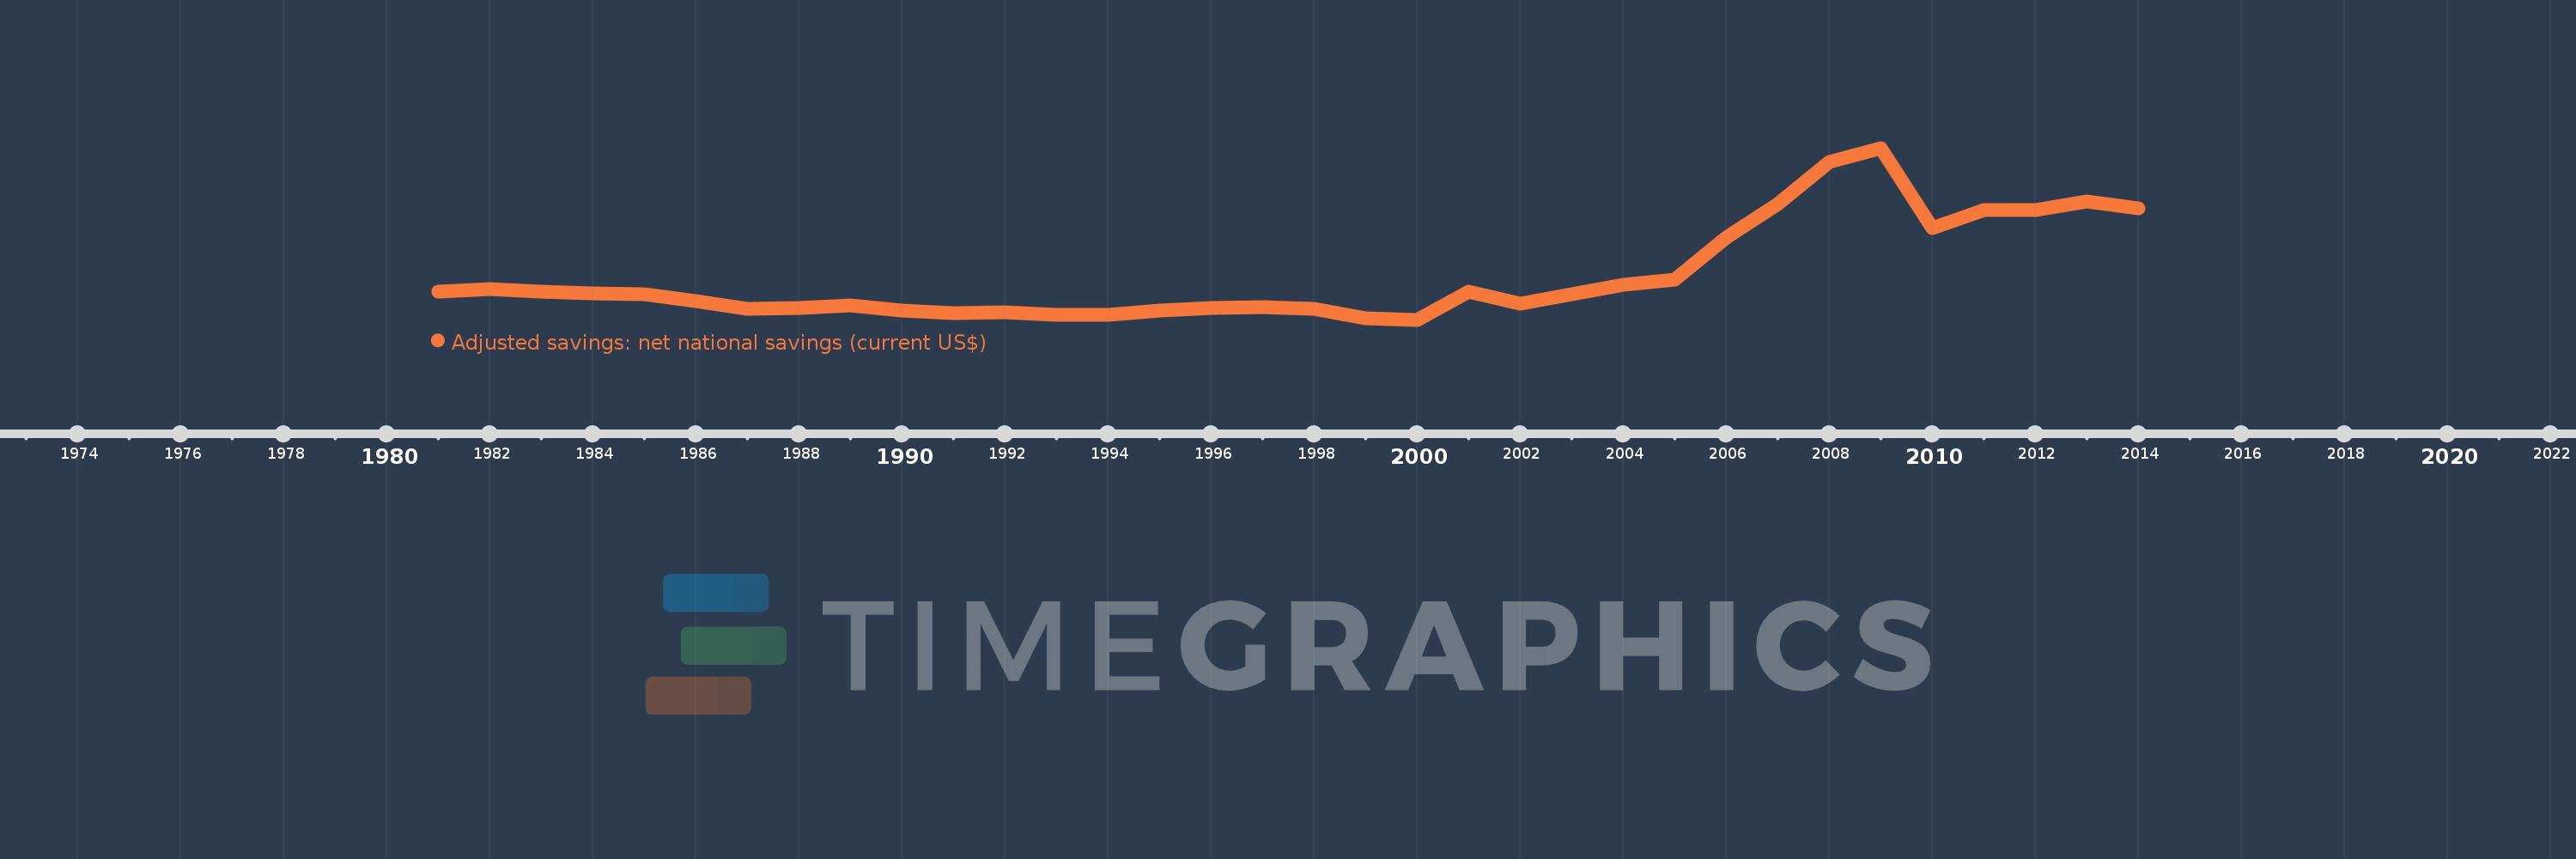
Adjusted savings: net national savings (current US$)
2014,2013,2012,2011,2010,2009,2008,2007,2006,2005,2004,2003,2002,2001,2000,1999,1998,1997,1996,1995,1994,1993,1992,1991,1990,1989,1988,1987,1986,1985,1984,1983,1982,1981
Cette statistique dans les autres pays:
AfghanistanAlbaniaAlgeriaAngolaAntigua and BarbudaArgentinaArmeniaAustraliaAustriaAzerbaijanBahamas, TheBahrainBangladeshBarbadosBelarusBelgiumBelizeBeninBermudaBhutanBoliviaBosnia and HerzegovinaBotswanaBrazilBrunei DarussalamBulgariaBurkina FasoBurundiCabo VerdeCambodiaCameroonCanadaCentral African RepublicChadChileChinaColombiaComorosCongo, Dem. Rep.Congo, Rep.Costa RicaCote d'IvoireCroatiaCyprusCzech RepublicDenmarkDjiboutiDominicaDominican RepublicEcuadorEgypt, Arab Rep.El SalvadorEquatorial GuineaEritreaEstoniaEthiopiaFijiFinlandFranceGabonGambia, TheGeorgiaGermanyGhanaGreeceGrenadaGuatemalaGuineaGuinea-BissauGuyanaHaitiHondurasHong Kong SAR, ChinaHungaryIcelandIndiaIndonesiaIran, Islamic Rep.IraqIrelandIsraelItalyJamaicaJapanJordanKazakhstanKenyaKiribatiKorea, Rep.KosovoKuwaitKyrgyz RepublicLao PDRLatviaLebanonLesothoLiberiaLibyaLithuaniaLuxembourgMacao SAR, ChinaMacedonia, FYRMadagascarMalawiMalaysiaMaldivesMaliMaltaMauritaniaMauritiusMexicoMoldovaMongoliaMontenegroMoroccoMozambiqueNamibiaNepalNetherlandsNew ZealandNicaraguaNigerNigeriaNorwayOmanPakistanPanamaPapua New GuineaParaguayPeruPhilippinesPolandPortugalQatarRomaniaRussian FederationRwandaSaudi ArabiaSenegalSerbiaSeychellesSierra LeoneSingaporeSlovak RepublicSloveniaSolomon IslandsSouth AfricaSpainSri LankaSt. Kitts and NevisSt. LuciaSt. Vincent and the GrenadinesSudanSurinameSwazilandSwedenSwitzerlandSyrian Arab RepublicTajikistanTanzaniaThailandTimor-LesteTogoTongaTrinidad and TobagoTunisiaTurkeyTurkmenistanUgandaUkraineUnited KingdomUnited StatesUruguayVanuatuVenezuela, RBVietnamWest Bank and GazaYemen, Rep.ZambiaZimbabwe La ligne de temps
Cette échelle de temps montre un graphique de 1981 année à 2014 année Bahrain. Les données jusqu'à 1980 année ne sont pas présentés. Quantité d'observations actuelles selon dates: 34.
Source (désignation):
Les indicateurs du développement mondiale
Source (organisation):
World Bank staff estimates based on sources and methods in World Bank's "The Changing Wealth of Nations: Measuring Sustainable Development in the New Millennium" (2011).
Catégories:
Economy & Growth, Environment
Dernière mise à jour
23 avr. 2017
Les indicateurs de changement de valeurs selon les années
Minimum:
-185.51 mln.
1 janv. 2000
Maximum:
10.019 mds
1 janv. 2009
Pour la date d''observation
Valeur
Changement absolu
Le changement par rapport à la valeur précédente
1 janv. 1981
1.495 mds
+1.495 mds
0.0%
1 janv. 1982
1.661 mds
+165.928 mln.
11.1%
1 janv. 1983
1.477 mds
-183.831 mln.
-11.07%
1 janv. 1984
1.4 mds
-77.167 mln.
-5.22%
1 janv. 1985
1.324 mds
-76.234 mln.
-5.45%
1 janv. 1986
930.264 mln.
-393.52 mln.
-29.73%
1 janv. 1987
438.279 mln.
-491.985 mln.
-52.89%
1 janv. 1988
511.572 mln.
+73.293 mln.
16.72%
1 janv. 1989
673.22 mln.
+161.648 mln.
31.6%
1 janv. 1990
358.778 mln.
-314.442 mln.
-46.71%
1 janv. 1991
185.918 mln.
-172.86 mln.
-48.18%
1 janv. 1992
249.953 mln.
+64.035 mln.
34.44%
1 janv. 1993
101.663 mln.
-148.291 mln.
-59.33%
1 janv. 1994
91.931 mln.
-9.732 mln.
-9.57%
1 janv. 1995
359.75 mln.
+267.82 mln.
291.33%
1 janv. 1996
502.367 mln.
+142.617 mln.
39.64%
1 janv. 1997
543.895 mln.
+41.528 mln.
8.27%
1 janv. 1998
486.865 mln.
-57.031 mln.
-10.49%
1 janv. 1999
-77.045 mln.
-563.91 mln.
-115.82%
1 janv. 2000
-185.51 mln.
-108.464 mln.
140.78%
1 janv. 2001
1.498 mds
+1.684 mds
-907.53%
1 janv. 2002
775.072 mln.
-722.967 mln.
-48.26%
1 janv. 2003
1.331 mds
+556.408 mln.
71.79%
1 janv. 2004
1.9 mds
+568.898 mln.
42.73%
1 janv. 2005
2.176 mds
+275.903 mln.
14.52%
1 janv. 2006
4.72 mds
+2.544 mds
116.88%
1 janv. 2007
6.677 mds
+1.957 mds
41.46%
1 janv. 2008
9.181 mds
+2.504 mds
37.5%
1 janv. 2009
10.019 mds
+838.62 mln.
9.13%
1 janv. 2010
5.255 mds
-4.765 mds
-47.55%
1 janv. 2011
6.328 mds
+1.073 mds
20.42%
1 janv. 2012
6.319 mds
-8.802 mln.
-0.14%
1 janv. 2013
6.825 mds
+506.386 mln.
8.01%
1 janv. 2014
6.448 mds
-377.455 mln.
-5.53%
Classement des pays selon les statistiques actuelles par années


Commentaires: