29
/fr/
fr
AIzaSyAYiBZKx7MnpbEhh9jyipgxe19OcubqV5w
April 1, 2024
230635
Rwanda
RWA
true
2
1
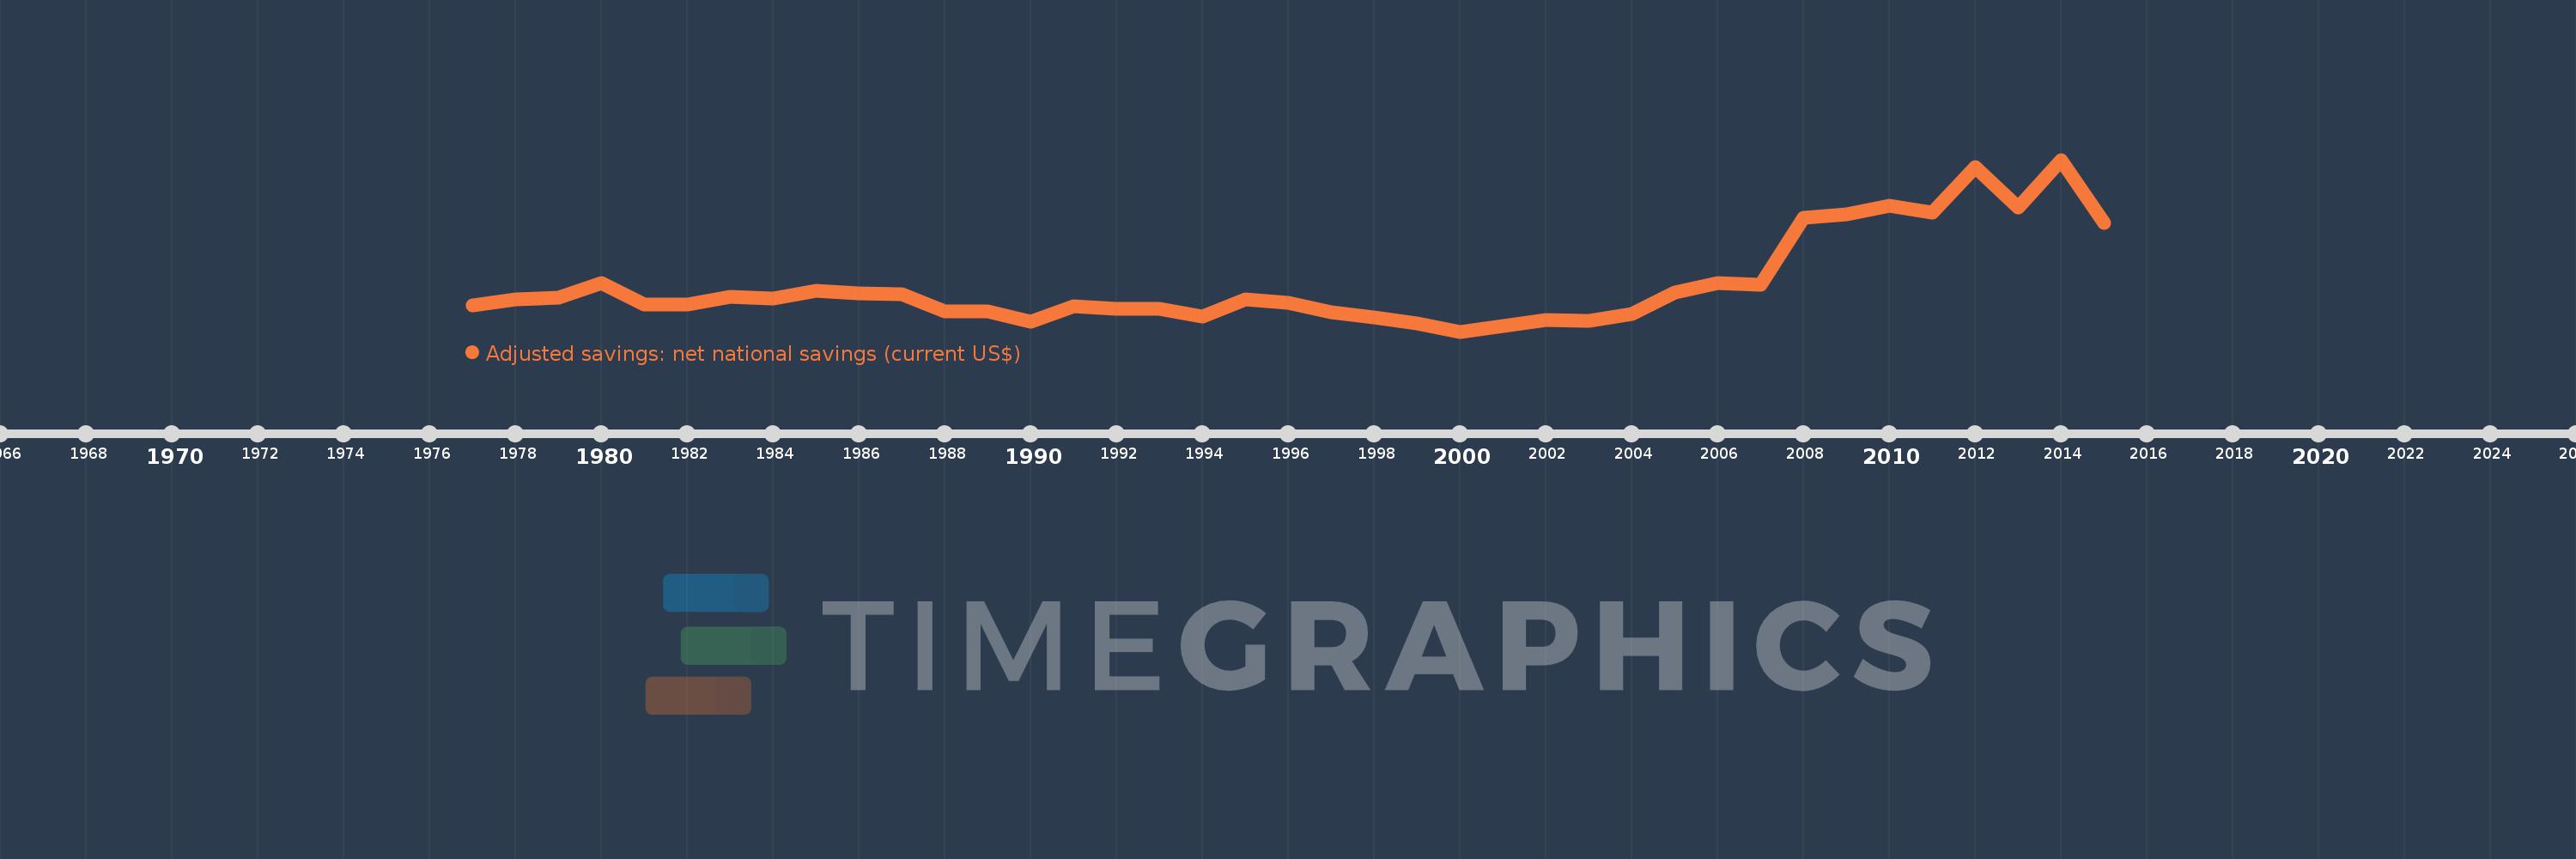
Adjusted savings: net national savings (current US$)
2015,2014,2013,2012,2011,2010,2009,2008,2007,2006,2005,2004,2003,2002,2001,2000,1999,1998,1997,1996,1995,1994,1993,1992,1991,1990,1989,1988,1987,1986,1985,1984,1983,1982,1981,1980,1979,1978,1977
Cette statistique dans les autres pays:
AfghanistanAlbaniaAlgeriaAngolaAntigua and BarbudaArgentinaArmeniaAustraliaAustriaAzerbaijanBahamas, TheBahrainBangladeshBarbadosBelarusBelgiumBelizeBeninBermudaBhutanBoliviaBosnia and HerzegovinaBotswanaBrazilBrunei DarussalamBulgariaBurkina FasoBurundiCabo VerdeCambodiaCameroonCanadaCentral African RepublicChadChileChinaColombiaComorosCongo, Dem. Rep.Congo, Rep.Costa RicaCote d'IvoireCroatiaCyprusCzech RepublicDenmarkDjiboutiDominicaDominican RepublicEcuadorEgypt, Arab Rep.El SalvadorEquatorial GuineaEritreaEstoniaEthiopiaFijiFinlandFranceGabonGambia, TheGeorgiaGermanyGhanaGreeceGrenadaGuatemalaGuineaGuinea-BissauGuyanaHaitiHondurasHong Kong SAR, ChinaHungaryIcelandIndiaIndonesiaIran, Islamic Rep.IraqIrelandIsraelItalyJamaicaJapanJordanKazakhstanKenyaKiribatiKorea, Rep.KosovoKuwaitKyrgyz RepublicLao PDRLatviaLebanonLesothoLiberiaLibyaLithuaniaLuxembourgMacao SAR, ChinaMacedonia, FYRMadagascarMalawiMalaysiaMaldivesMaliMaltaMauritaniaMauritiusMexicoMoldovaMongoliaMontenegroMoroccoMozambiqueNamibiaNepalNetherlandsNew ZealandNicaraguaNigerNigeriaNorwayOmanPakistanPanamaPapua New GuineaParaguayPeruPhilippinesPolandPortugalQatarRomaniaRussian FederationRwandaSaudi ArabiaSenegalSerbiaSeychellesSierra LeoneSingaporeSlovak RepublicSloveniaSolomon IslandsSouth AfricaSpainSri LankaSt. Kitts and NevisSt. LuciaSt. Vincent and the GrenadinesSudanSurinameSwazilandSwedenSwitzerlandSyrian Arab RepublicTajikistanTanzaniaThailandTimor-LesteTogoTongaTrinidad and TobagoTunisiaTurkeyTurkmenistanUgandaUkraineUnited KingdomUnited StatesUruguayVanuatuVenezuela, RBVietnamWest Bank and GazaYemen, Rep.ZambiaZimbabwe La ligne de temps
Cette échelle de temps montre un graphique de 1977 année à 2015 année Rwanda. Les données jusqu'à 1976 année ne sont pas présentés. Quantité d'observations actuelles selon dates: 39.
Source (désignation):
Les indicateurs du développement mondiale
Source (organisation):
World Bank staff estimates based on sources and methods in World Bank's "The Changing Wealth of Nations: Measuring Sustainable Development in the New Millennium" (2011).
Catégories:
Economy & Growth, Environment
Dernière mise à jour
23 avr. 2017
Les indicateurs de changement de valeurs selon les années
Minimum:
-59.287 mln.
1 janv. 2000
Maximum:
917.735 mln.
1 janv. 2014
Pour la date d''observation
Valeur
Changement absolu
Le changement par rapport à la valeur précédente
1 janv. 1977
87.347 mln.
+87.347 mln.
0.0%
1 janv. 1978
125.364 mln.
+38.017 mln.
43.52%
1 janv. 1979
133.503 mln.
+8.139 mln.
6.49%
1 janv. 1980
216.322 mln.
+82.819 mln.
62.03%
1 janv. 1981
96.052 mln.
-120.27 mln.
-55.6%
1 janv. 1982
94.469 mln.
-1.583 mln.
-1.65%
1 janv. 1983
138.736 mln.
+44.267 mln.
46.86%
1 janv. 1984
129.215 mln.
-9.521 mln.
-6.86%
1 janv. 1985
173.41 mln.
+44.195 mln.
34.2%
1 janv. 1986
156.338 mln.
-17.072 mln.
-9.84%
1 janv. 1987
153.69 mln.
-2.649 mln.
-1.69%
1 janv. 1988
57.556 mln.
-96.134 mln.
-62.55%
1 janv. 1989
53.387 mln.
-4.169 mln.
-7.24%
1 janv. 1990
-2.822 mln.
-56.21 mln.
-105.29%
1 janv. 1991
85.052 mln.
+87.874 mln.
-3.11 milles%
1 janv. 1992
71.153 mln.
-13.899 mln.
-16.34%
1 janv. 1993
68.163 mln.
-2.99 mln.
-4.2%
1 janv. 1994
23.769 mln.
-44.394 mln.
-65.13%
1 janv. 1995
124.106 mln.
+100.337 mln.
422.14%
1 janv. 1996
102.202 mln.
-21.904 mln.
-17.65%
1 janv. 1997
50.188 mln.
-52.014 mln.
-50.89%
1 janv. 1998
21.33 mln.
-28.858 mln.
-57.5%
1 janv. 1999
-14.831 mln.
-36.161 mln.
-169.53%
1 janv. 2000
-59.287 mln.
-44.457 mln.
299.77%
1 janv. 2001
-28.51 mln.
+30.777 mln.
-51.91%
1 janv. 2002
6.232 mln.
+34.742 mln.
-121.86%
1 janv. 2003
2.958 mln.
-3.275 mln.
-52.54%
1 janv. 2004
40.34 mln.
+37.383 mln.
1.26 milles%
1 janv. 2005
162.187 mln.
+121.846 mln.
302.04%
1 janv. 2006
216.353 mln.
+54.166 mln.
33.4%
1 janv. 2007
205.049 mln.
-11.304 mln.
-5.22%
1 janv. 2008
588.573 mln.
+383.524 mln.
187.04%
1 janv. 2009
607.437 mln.
+18.865 mln.
3.21%
1 janv. 2010
658.679 mln.
+51.242 mln.
8.44%
1 janv. 2011
616.946 mln.
-41.733 mln.
-6.34%
1 janv. 2012
878.153 mln.
+261.207 mln.
42.34%
1 janv. 2013
647.615 mln.
-230.538 mln.
-26.25%
1 janv. 2014
917.735 mln.
+270.121 mln.
41.71%
1 janv. 2015
559.596 mln.
-358.139 mln.
-39.02%
Classement des pays selon les statistiques actuelles par années


Commentaires: