29
/fr/
fr
AIzaSyAYiBZKx7MnpbEhh9jyipgxe19OcubqV5w
April 1, 2024
206360
Nepal
NPL
true
2
1
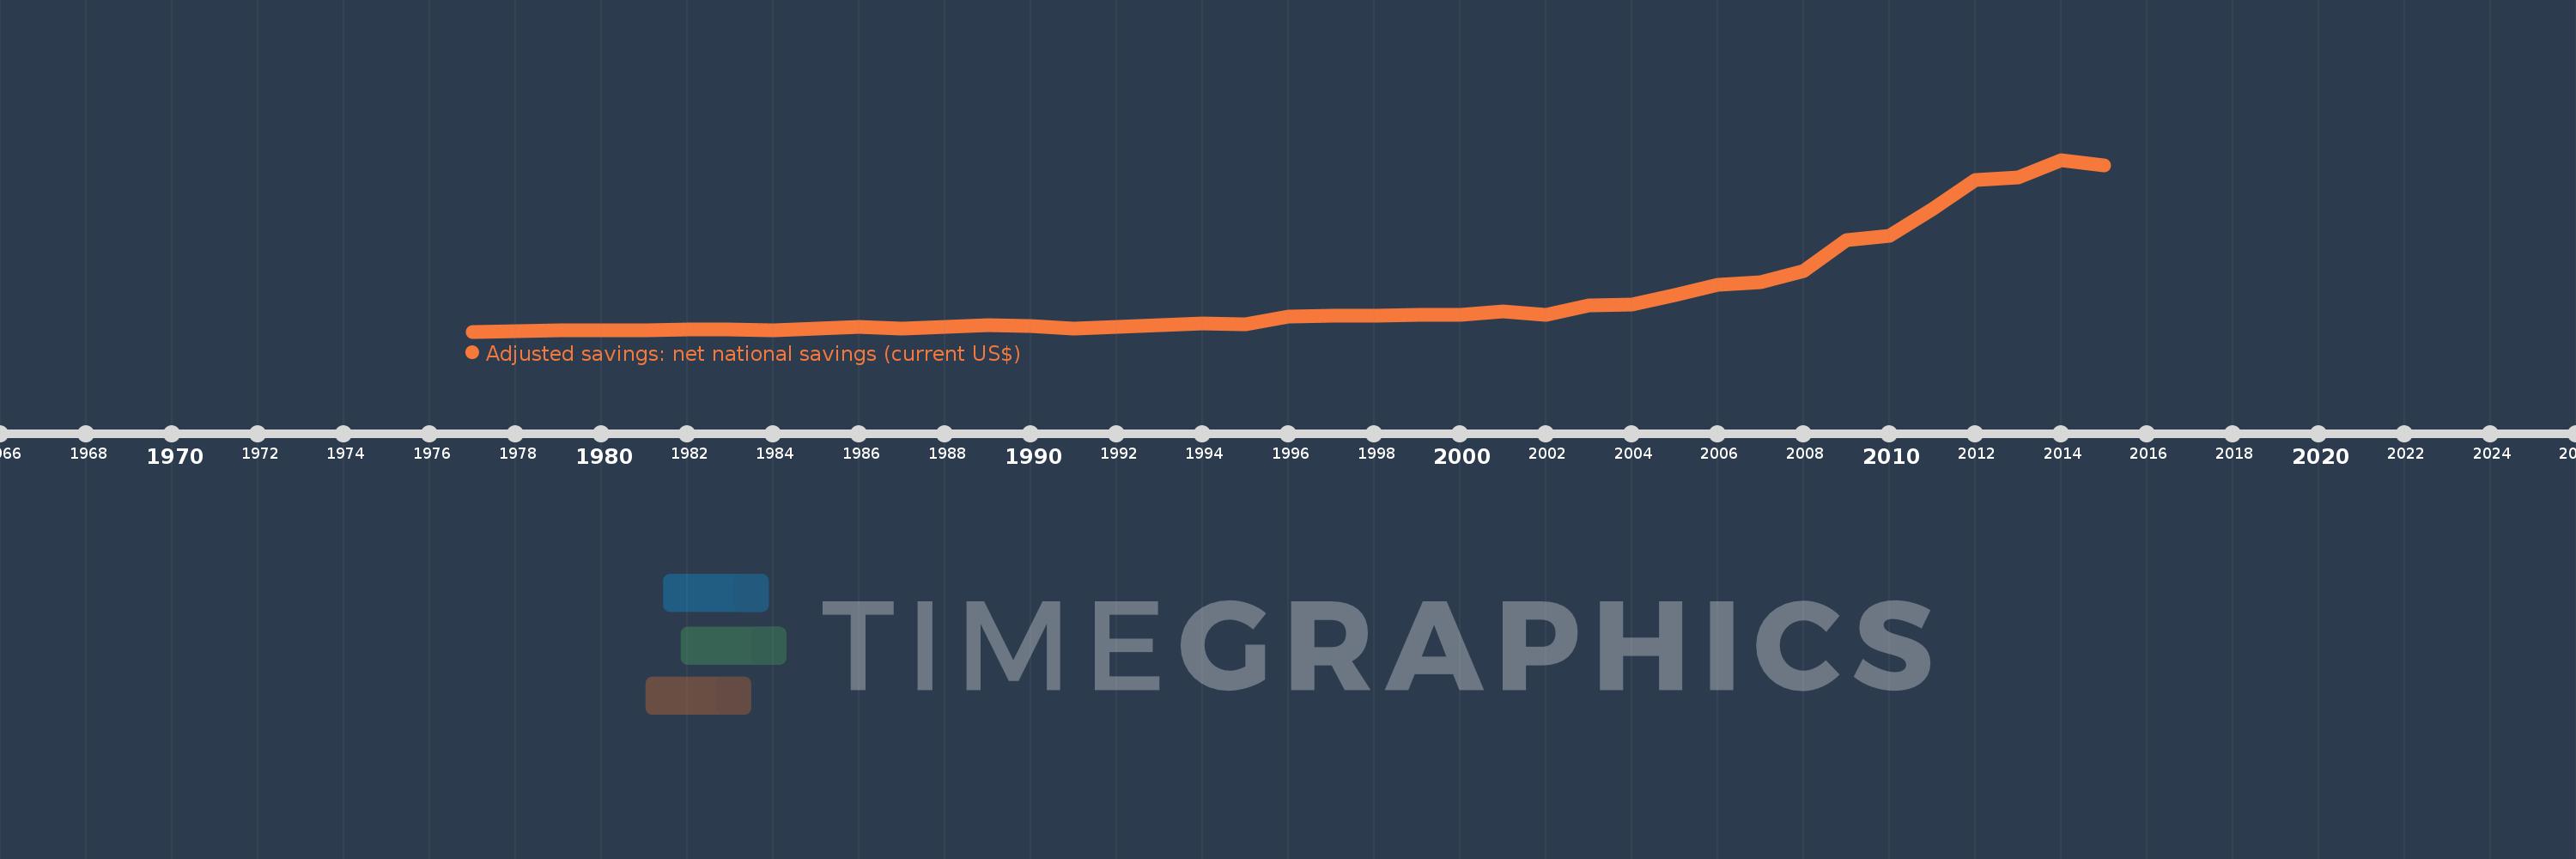
Adjusted savings: net national savings (current US$)
2015,2014,2013,2012,2011,2010,2009,2008,2007,2006,2005,2004,2003,2002,2001,2000,1999,1998,1997,1996,1995,1994,1993,1992,1991,1990,1989,1988,1987,1986,1985,1984,1983,1982,1981,1980,1979,1978,1977
Cette statistique dans les autres pays:
AfghanistanAlbaniaAlgeriaAngolaAntigua and BarbudaArgentinaArmeniaAustraliaAustriaAzerbaijanBahamas, TheBahrainBangladeshBarbadosBelarusBelgiumBelizeBeninBermudaBhutanBoliviaBosnia and HerzegovinaBotswanaBrazilBrunei DarussalamBulgariaBurkina FasoBurundiCabo VerdeCambodiaCameroonCanadaCentral African RepublicChadChileChinaColombiaComorosCongo, Dem. Rep.Congo, Rep.Costa RicaCote d'IvoireCroatiaCyprusCzech RepublicDenmarkDjiboutiDominicaDominican RepublicEcuadorEgypt, Arab Rep.El SalvadorEquatorial GuineaEritreaEstoniaEthiopiaFijiFinlandFranceGabonGambia, TheGeorgiaGermanyGhanaGreeceGrenadaGuatemalaGuineaGuinea-BissauGuyanaHaitiHondurasHong Kong SAR, ChinaHungaryIcelandIndiaIndonesiaIran, Islamic Rep.IraqIrelandIsraelItalyJamaicaJapanJordanKazakhstanKenyaKiribatiKorea, Rep.KosovoKuwaitKyrgyz RepublicLao PDRLatviaLebanonLesothoLiberiaLibyaLithuaniaLuxembourgMacao SAR, ChinaMacedonia, FYRMadagascarMalawiMalaysiaMaldivesMaliMaltaMauritaniaMauritiusMexicoMoldovaMongoliaMontenegroMoroccoMozambiqueNamibiaNepalNetherlandsNew ZealandNicaraguaNigerNigeriaNorwayOmanPakistanPanamaPapua New GuineaParaguayPeruPhilippinesPolandPortugalQatarRomaniaRussian FederationRwandaSaudi ArabiaSenegalSerbiaSeychellesSierra LeoneSingaporeSlovak RepublicSloveniaSolomon IslandsSouth AfricaSpainSri LankaSt. Kitts and NevisSt. LuciaSt. Vincent and the GrenadinesSudanSurinameSwazilandSwedenSwitzerlandSyrian Arab RepublicTajikistanTanzaniaThailandTimor-LesteTogoTongaTrinidad and TobagoTunisiaTurkeyTurkmenistanUgandaUkraineUnited KingdomUnited StatesUruguayVanuatuVenezuela, RBVietnamWest Bank and GazaYemen, Rep.ZambiaZimbabwe La ligne de temps
Cette échelle de temps montre un graphique de 1977 année à 2015 année Nepal. Les données jusqu'à 1976 année ne sont pas présentés. Quantité d'observations actuelles selon dates: 39.
Source (désignation):
Les indicateurs du développement mondiale
Source (organisation):
World Bank staff estimates based on sources and methods in World Bank's "The Changing Wealth of Nations: Measuring Sustainable Development in the New Millennium" (2011).
Catégories:
Economy & Growth, Environment
Dernière mise à jour
23 avr. 2017
Les indicateurs de changement de valeurs selon les années
Minimum:
182.285 mln.
1 janv. 1977
Maximum:
7.28 mds
1 janv. 2014
Pour la date d''observation
Valeur
Changement absolu
Le changement par rapport à la valeur précédente
1 janv. 1977
182.285 mln.
+182.285 mln.
0.0%
1 janv. 1978
196.104 mln.
+13.819 mln.
7.58%
1 janv. 1979
222.786 mln.
+26.682 mln.
13.61%
1 janv. 1980
229.396 mln.
+6.61 mln.
2.97%
1 janv. 1981
245.658 mln.
+16.263 mln.
7.09%
1 janv. 1982
277.466 mln.
+31.808 mln.
12.95%
1 janv. 1983
282.57 mln.
+5.103 mln.
1.84%
1 janv. 1984
240.24 mln.
-42.33 mln.
-14.98%
1 janv. 1985
298.776 mln.
+58.536 mln.
24.37%
1 janv. 1986
372.342 mln.
+73.567 mln.
24.62%
1 janv. 1987
320.333 mln.
-52.01 mln.
-13.97%
1 janv. 1988
375.383 mln.
+55.05 mln.
17.19%
1 janv. 1989
439.137 mln.
+63.754 mln.
16.98%
1 janv. 1990
401.532 mln.
-37.604 mln.
-8.56%
1 janv. 1991
300.708 mln.
-100.825 mln.
-25.11%
1 janv. 1992
382.185 mln.
+81.477 mln.
27.1%
1 janv. 1993
440.907 mln.
+58.722 mln.
15.36%
1 janv. 1994
526.897 mln.
+85.99 mln.
19.5%
1 janv. 1995
479.965 mln.
-46.932 mln.
-8.91%
1 janv. 1996
811.312 mln.
+331.347 mln.
69.04%
1 janv. 1997
840.648 mln.
+29.336 mln.
3.62%
1 janv. 1998
840.74 mln.
+91.576 milles
0.01%
1 janv. 1999
861.785 mln.
+21.046 mln.
2.5%
1 janv. 2000
870.299 mln.
+8.514 mln.
0.99%
1 janv. 2001
1.004 mds
+133.36 mln.
15.32%
1 janv. 2002
877.957 mln.
-125.702 mln.
-12.52%
1 janv. 2003
1.258 mds
+380.209 mln.
43.31%
1 janv. 2004
1.311 mds
+52.611 mln.
4.18%
1 janv. 2005
1.682 mds
+371.489 mln.
28.34%
1 janv. 2006
2.117 mds
+434.602 mln.
25.83%
1 janv. 2007
2.239 mds
+121.929 mln.
5.76%
1 janv. 2008
2.694 mds
+455.159 mln.
20.33%
1 janv. 2009
3.975 mds
+1.281 mds
47.56%
1 janv. 2010
4.135 mds
+160.174 mln.
4.03%
1 janv. 2011
5.234 mds
+1.099 mds
26.58%
1 janv. 2012
6.463 mds
+1.229 mds
23.48%
1 janv. 2013
6.564 mds
+100.825 mln.
1.56%
1 janv. 2014
7.28 mds
+715.853 mln.
10.91%
1 janv. 2015
7.044 mds
-236.363 mln.
-3.25%
Classement des pays selon les statistiques actuelles par années


Commentaires: