29
/fr/
fr
AIzaSyAYiBZKx7MnpbEhh9jyipgxe19OcubqV5w
April 1, 2024
191120
Malta
MLT
true
2
1
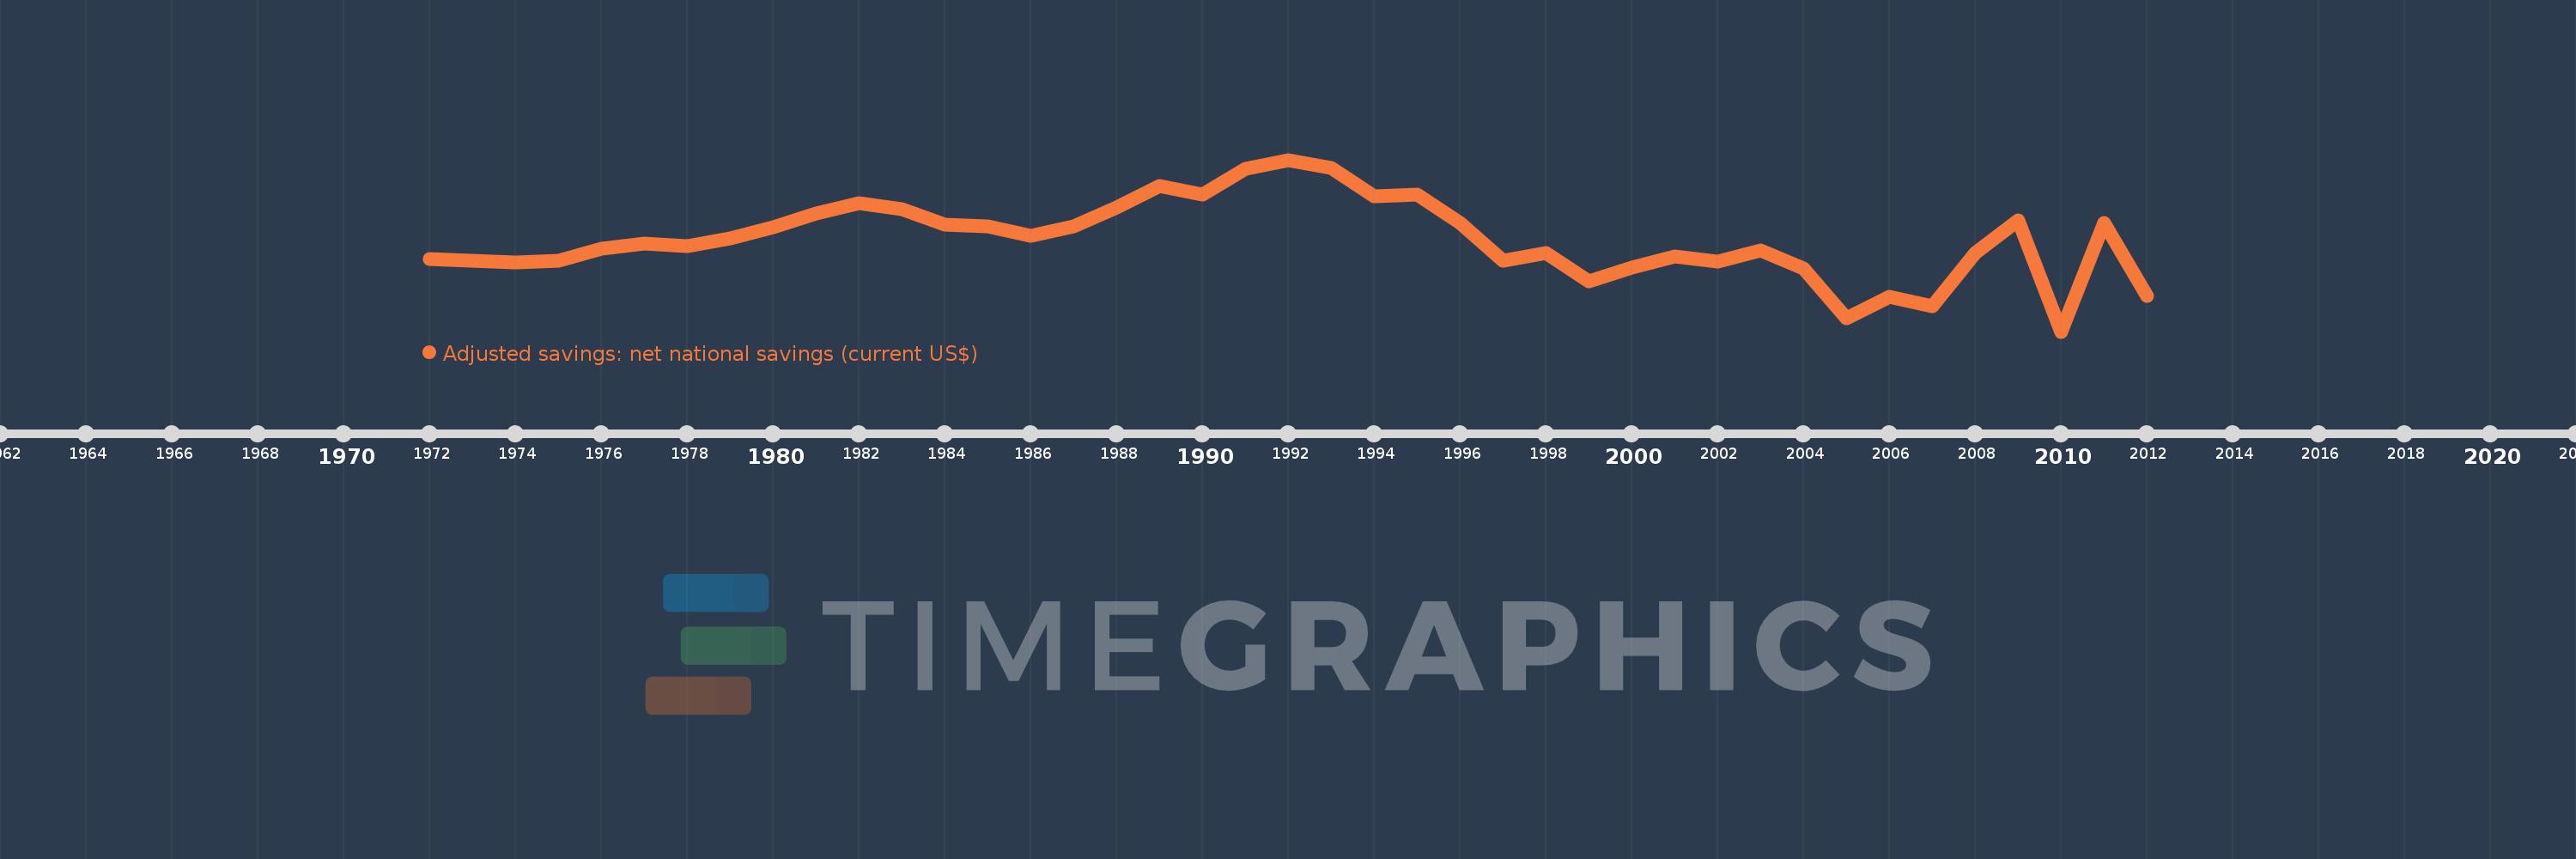
Adjusted savings: net national savings (current US$)
2012,2011,2010,2009,2008,2007,2006,2005,2004,2003,2002,2001,2000,1999,1998,1997,1996,1995,1994,1993,1992,1991,1990,1989,1988,1987,1986,1985,1984,1983,1982,1981,1980,1979,1978,1977,1976,1975,1974,1973,1972
Cette statistique dans les autres pays:
AfghanistanAlbaniaAlgeriaAngolaAntigua and BarbudaArgentinaArmeniaAustraliaAustriaAzerbaijanBahamas, TheBahrainBangladeshBarbadosBelarusBelgiumBelizeBeninBermudaBhutanBoliviaBosnia and HerzegovinaBotswanaBrazilBrunei DarussalamBulgariaBurkina FasoBurundiCabo VerdeCambodiaCameroonCanadaCentral African RepublicChadChileChinaColombiaComorosCongo, Dem. Rep.Congo, Rep.Costa RicaCote d'IvoireCroatiaCyprusCzech RepublicDenmarkDjiboutiDominicaDominican RepublicEcuadorEgypt, Arab Rep.El SalvadorEquatorial GuineaEritreaEstoniaEthiopiaFijiFinlandFranceGabonGambia, TheGeorgiaGermanyGhanaGreeceGrenadaGuatemalaGuineaGuinea-BissauGuyanaHaitiHondurasHong Kong SAR, ChinaHungaryIcelandIndiaIndonesiaIran, Islamic Rep.IraqIrelandIsraelItalyJamaicaJapanJordanKazakhstanKenyaKiribatiKorea, Rep.KosovoKuwaitKyrgyz RepublicLao PDRLatviaLebanonLesothoLiberiaLibyaLithuaniaLuxembourgMacao SAR, ChinaMacedonia, FYRMadagascarMalawiMalaysiaMaldivesMaliMaltaMauritaniaMauritiusMexicoMoldovaMongoliaMontenegroMoroccoMozambiqueNamibiaNepalNetherlandsNew ZealandNicaraguaNigerNigeriaNorwayOmanPakistanPanamaPapua New GuineaParaguayPeruPhilippinesPolandPortugalQatarRomaniaRussian FederationRwandaSaudi ArabiaSenegalSerbiaSeychellesSierra LeoneSingaporeSlovak RepublicSloveniaSolomon IslandsSouth AfricaSpainSri LankaSt. Kitts and NevisSt. LuciaSt. Vincent and the GrenadinesSudanSurinameSwazilandSwedenSwitzerlandSyrian Arab RepublicTajikistanTanzaniaThailandTimor-LesteTogoTongaTrinidad and TobagoTunisiaTurkeyTurkmenistanUgandaUkraineUnited KingdomUnited StatesUruguayVanuatuVenezuela, RBVietnamWest Bank and GazaYemen, Rep.ZambiaZimbabwe La ligne de temps
Cette échelle de temps montre un graphique de 1972 année à 2012 année Malta. Les données jusqu'à 1971 année ne sont pas présentés. Quantité d'observations actuelles selon dates: 41.
Source (désignation):
Les indicateurs du développement mondiale
Source (organisation):
World Bank staff estimates based on sources and methods in World Bank's "The Changing Wealth of Nations: Measuring Sustainable Development in the New Millennium" (2011).
Catégories:
Economy & Growth, Environment
Dernière mise à jour
23 avr. 2017
Les indicateurs de changement de valeurs selon les années
Minimum:
-285.977 mln.
1 janv. 2010
Maximum:
478.251 mln.
1 janv. 1992
Pour la date d''observation
Valeur
Changement absolu
Le changement par rapport à la valeur précédente
1 janv. 1972
35.174 mln.
+35.174 mln.
0.0%
1 janv. 1973
28.841 mln.
-6.332 mln.
-18.0%
1 janv. 1974
20.589 mln.
-8.252 mln.
-28.61%
1 janv. 1975
28.336 mln.
+7.746 mln.
37.62%
1 janv. 1976
81.319 mln.
+52.984 mln.
186.99%
1 janv. 1977
106.616 mln.
+25.296 mln.
31.11%
1 janv. 1978
95.125 mln.
-11.491 mln.
-10.78%
1 janv. 1979
127.919 mln.
+32.794 mln.
34.47%
1 janv. 1980
176.98 mln.
+49.061 mln.
38.35%
1 janv. 1981
237.817 mln.
+60.836 mln.
34.37%
1 janv. 1982
287.133 mln.
+49.316 mln.
20.74%
1 janv. 1983
256.949 mln.
-30.184 mln.
-10.51%
1 janv. 1984
190.152 mln.
-66.797 mln.
-26.0%
1 janv. 1985
182.913 mln.
-7.239 mln.
-3.81%
1 janv. 1986
141.469 mln.
-41.444 mln.
-22.66%
1 janv. 1987
183.1 mln.
+41.631 mln.
29.43%
1 janv. 1988
265.209 mln.
+82.109 mln.
44.84%
1 janv. 1989
362.444 mln.
+97.235 mln.
36.66%
1 janv. 1990
323.491 mln.
-38.953 mln.
-10.75%
1 janv. 1991
437.561 mln.
+114.07 mln.
35.26%
1 janv. 1992
478.251 mln.
+40.69 mln.
9.3%
1 janv. 1993
441.92 mln.
-36.332 mln.
-7.6%
1 janv. 1994
316.462 mln.
-125.458 mln.
-28.39%
1 janv. 1995
322.367 mln.
+5.906 mln.
1.87%
1 janv. 1996
198.311 mln.
-124.057 mln.
-38.48%
1 janv. 1997
27.645 mln.
-170.666 mln.
-86.06%
1 janv. 1998
62.069 mln.
+34.424 mln.
124.52%
1 janv. 1999
-62.75 mln.
-124.82 mln.
-201.1%
1 janv. 2000
346.129 milles
+63.096 mln.
-100.55%
1 janv. 2001
48.982 mln.
+48.636 mln.
14.05 milles%
1 janv. 2002
23.996 mln.
-24.986 mln.
-51.01%
1 janv. 2003
75.577 mln.
+51.581 mln.
214.95%
1 janv. 2004
-6.991 mln.
-82.568 mln.
-109.25%
1 janv. 2005
-228.539 mln.
-221.548 mln.
3.17 milles%
1 janv. 2006
-131.117 mln.
+97.422 mln.
-42.63%
1 janv. 2007
-174.671 mln.
-43.554 mln.
33.22%
1 janv. 2008
64.121 mln.
+238.792 mln.
-136.71%
1 janv. 2009
210.55 mln.
+146.429 mln.
228.36%
1 janv. 2010
-285.977 mln.
-496.527 mln.
-235.82%
1 janv. 2011
198.802 mln.
+484.779 mln.
-169.52%
1 janv. 2012
-125.827 mln.
-324.629 mln.
-163.29%
Classement des pays selon les statistiques actuelles par années


Commentaires: