29
/fr/
fr
AIzaSyAYiBZKx7MnpbEhh9jyipgxe19OcubqV5w
April 1, 2024
225583
Portugal
PRT
true
2
1
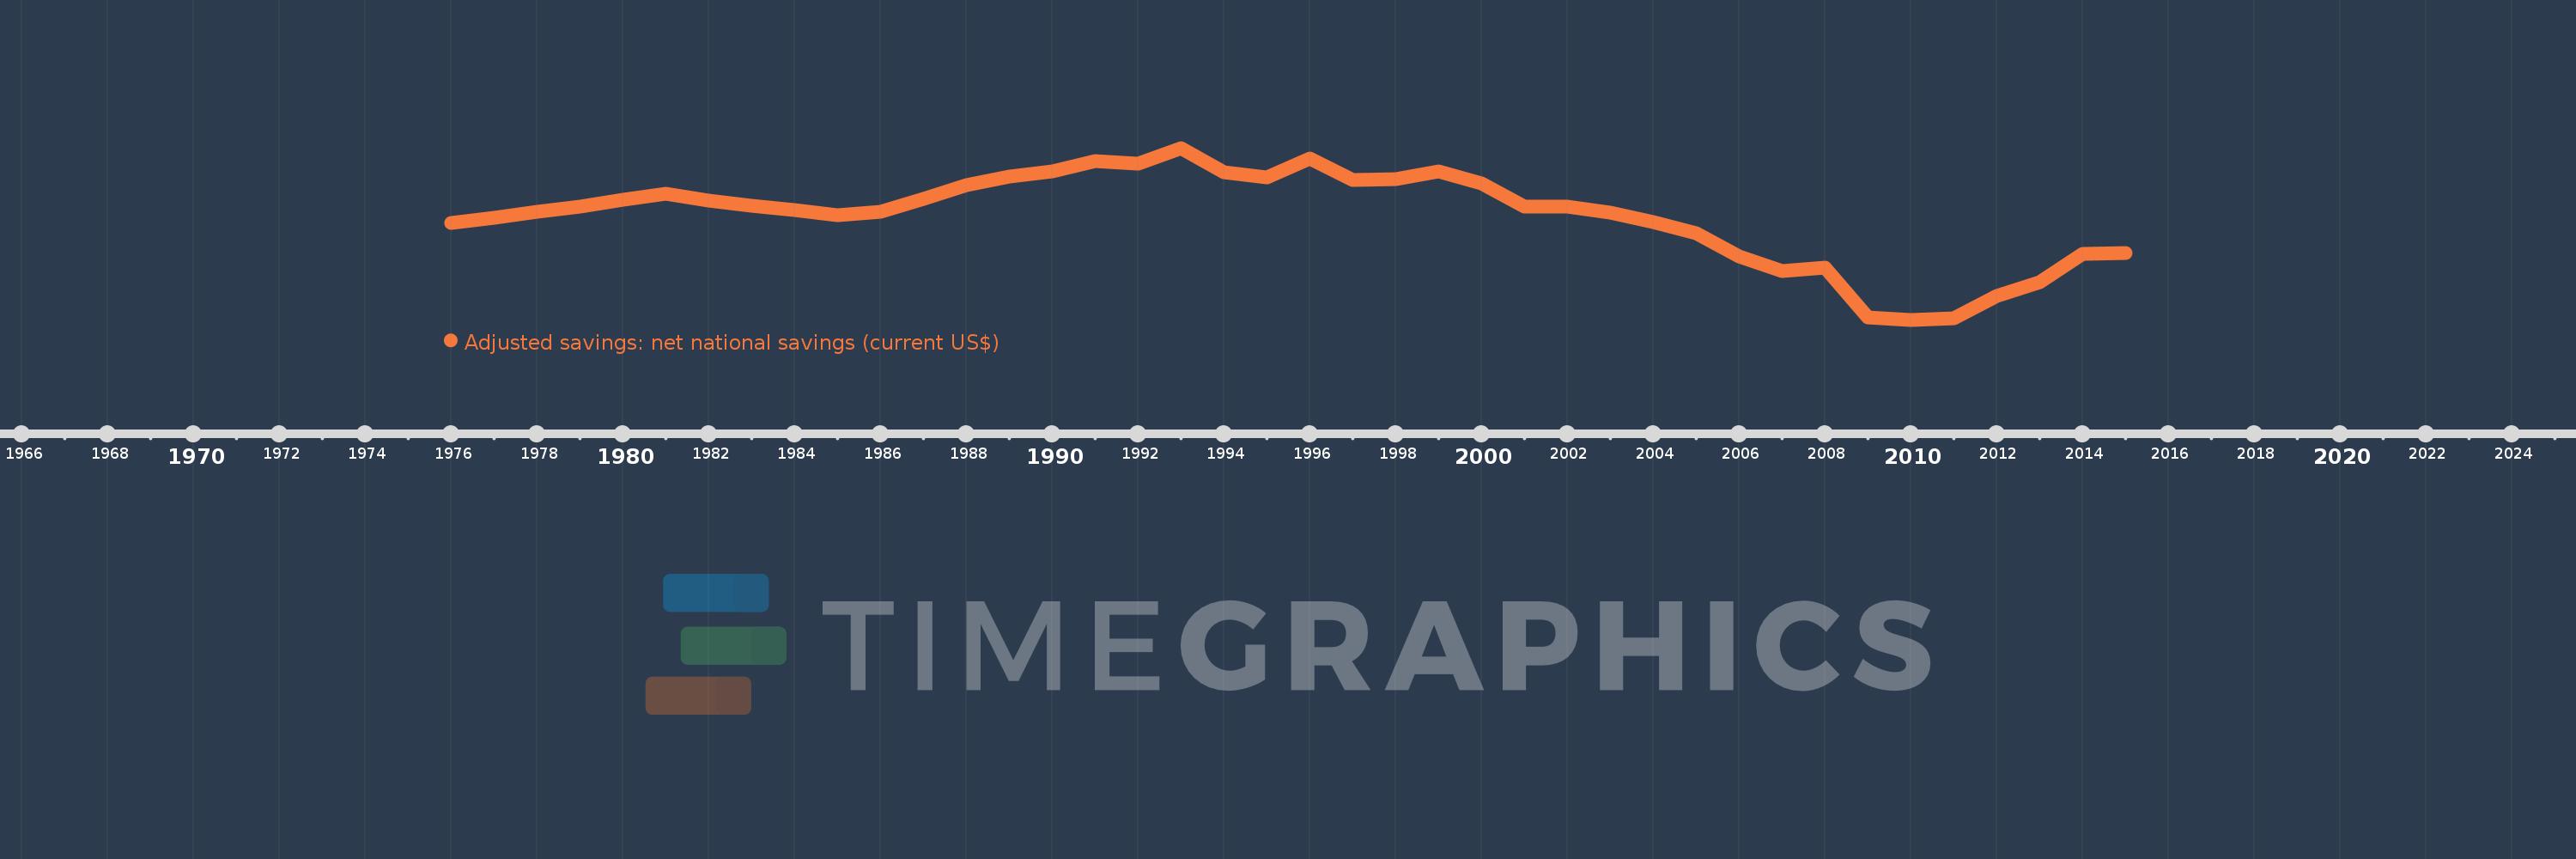
Adjusted savings: net national savings (current US$)
2015,2014,2013,2012,2011,2010,2009,2008,2007,2006,2005,2004,2003,2002,2001,2000,1999,1998,1997,1996,1995,1994,1993,1992,1991,1990,1989,1988,1987,1986,1985,1984,1983,1982,1981,1980,1979,1978,1977,1976
Cette statistique dans les autres pays:
AfghanistanAlbaniaAlgeriaAngolaAntigua and BarbudaArgentinaArmeniaAustraliaAustriaAzerbaijanBahamas, TheBahrainBangladeshBarbadosBelarusBelgiumBelizeBeninBermudaBhutanBoliviaBosnia and HerzegovinaBotswanaBrazilBrunei DarussalamBulgariaBurkina FasoBurundiCabo VerdeCambodiaCameroonCanadaCentral African RepublicChadChileChinaColombiaComorosCongo, Dem. Rep.Congo, Rep.Costa RicaCote d'IvoireCroatiaCyprusCzech RepublicDenmarkDjiboutiDominicaDominican RepublicEcuadorEgypt, Arab Rep.El SalvadorEquatorial GuineaEritreaEstoniaEthiopiaFijiFinlandFranceGabonGambia, TheGeorgiaGermanyGhanaGreeceGrenadaGuatemalaGuineaGuinea-BissauGuyanaHaitiHondurasHong Kong SAR, ChinaHungaryIcelandIndiaIndonesiaIran, Islamic Rep.IraqIrelandIsraelItalyJamaicaJapanJordanKazakhstanKenyaKiribatiKorea, Rep.KosovoKuwaitKyrgyz RepublicLao PDRLatviaLebanonLesothoLiberiaLibyaLithuaniaLuxembourgMacao SAR, ChinaMacedonia, FYRMadagascarMalawiMalaysiaMaldivesMaliMaltaMauritaniaMauritiusMexicoMoldovaMongoliaMontenegroMoroccoMozambiqueNamibiaNepalNetherlandsNew ZealandNicaraguaNigerNigeriaNorwayOmanPakistanPanamaPapua New GuineaParaguayPeruPhilippinesPolandPortugalQatarRomaniaRussian FederationRwandaSaudi ArabiaSenegalSerbiaSeychellesSierra LeoneSingaporeSlovak RepublicSloveniaSolomon IslandsSouth AfricaSpainSri LankaSt. Kitts and NevisSt. LuciaSt. Vincent and the GrenadinesSudanSurinameSwazilandSwedenSwitzerlandSyrian Arab RepublicTajikistanTanzaniaThailandTimor-LesteTogoTongaTrinidad and TobagoTunisiaTurkeyTurkmenistanUgandaUkraineUnited KingdomUnited StatesUruguayVanuatuVenezuela, RBVietnamWest Bank and GazaYemen, Rep.ZambiaZimbabwe La ligne de temps
Cette échelle de temps montre un graphique de 1976 année à 2015 année Portugal. Les données jusqu'à 1975 année ne sont pas présentés. Quantité d'observations actuelles selon dates: 40.
Source (désignation):
Les indicateurs du développement mondiale
Source (organisation):
World Bank staff estimates based on sources and methods in World Bank's "The Changing Wealth of Nations: Measuring Sustainable Development in the New Millennium" (2011).
Catégories:
Economy & Growth, Environment
Dernière mise à jour
23 avr. 2017
Les indicateurs de changement de valeurs selon les années
Minimum:
-16.662 mds
1 janv. 2010
Maximum:
12.682 mds
1 janv. 1993
Pour la date d''observation
Valeur
Changement absolu
Le changement par rapport à la valeur précédente
1 janv. 1976
-153.364 mln.
-153.364 mln.
0.0%
1 janv. 1977
799.989 mln.
+953.353 mln.
-621.63%
1 janv. 1978
1.773 mds
+972.645 mln.
121.58%
1 janv. 1979
2.688 mds
+914.975 mln.
51.62%
1 janv. 1980
3.84 mds
+1.152 mds
42.87%
1 janv. 1981
4.791 mds
+950.815 mln.
24.76%
1 janv. 1982
3.746 mds
-1.045 mds
-21.81%
1 janv. 1983
2.843 mds
-903.152 mln.
-24.11%
1 janv. 1984
2.037 mds
-805.881 mln.
-28.35%
1 janv. 1985
1.159 mds
-878.026 mln.
-43.11%
1 janv. 1986
1.726 mds
+567.134 mln.
48.95%
1 janv. 1987
4.028 mds
+2.302 mds
133.41%
1 janv. 1988
6.306 mds
+2.277 mds
56.54%
1 janv. 1989
7.75 mds
+1.445 mds
22.91%
1 janv. 1990
8.654 mds
+903.377 mln.
11.66%
1 janv. 1991
10.509 mds
+1.856 mds
21.44%
1 janv. 1992
9.956 mds
-552.903 mln.
-5.26%
1 janv. 1993
12.682 mds
+2.726 mds
27.38%
1 janv. 1994
8.505 mds
-4.177 mds
-32.93%
1 janv. 1995
7.643 mds
-862.362 mln.
-10.14%
1 janv. 1996
10.805 mds
+3.162 mds
41.37%
1 janv. 1997
7.148 mds
-3.657 mds
-33.84%
1 janv. 1998
7.287 mds
+138.695 mln.
1.94%
1 janv. 1999
8.724 mds
+1.437 mds
19.71%
1 janv. 2000
6.606 mds
-2.117 mds
-24.27%
1 janv. 2001
2.712 mds
-3.895 mds
-58.95%
1 janv. 2002
2.654 mds
-57.412 mln.
-2.12%
1 janv. 2003
1.68 mds
-974.683 mln.
-36.72%
1 janv. 2004
33.238 mln.
-1.646 mds
-98.02%
1 janv. 2005
-1.871 mds
-1.904 mds
-5.73 milles%
1 janv. 2006
-5.834 mds
-3.963 mds
211.8%
1 janv. 2007
-8.383 mds
-2.549 mds
43.7%
1 janv. 2008
-7.77 mds
+612.867 mln.
-7.31%
1 janv. 2009
-16.246 mds
-8.476 mds
109.08%
1 janv. 2010
-16.662 mds
-415.869 mln.
2.56%
1 janv. 2011
-16.479 mds
+182.34 mln.
-1.09%
1 janv. 2012
-12.527 mds
+3.952 mds
-23.98%
1 janv. 2013
-10.306 mds
+2.221 mds
-17.73%
1 janv. 2014
-5.339 mds
+4.966 mds
-48.19%
1 janv. 2015
-5.221 mds
+118.825 mln.
-2.23%
Classement des pays selon les statistiques actuelles par années


Commentaires: