29
/fr/
fr
AIzaSyAYiBZKx7MnpbEhh9jyipgxe19OcubqV5w
April 1, 2024
74299
Austria
AUT
true
2
1
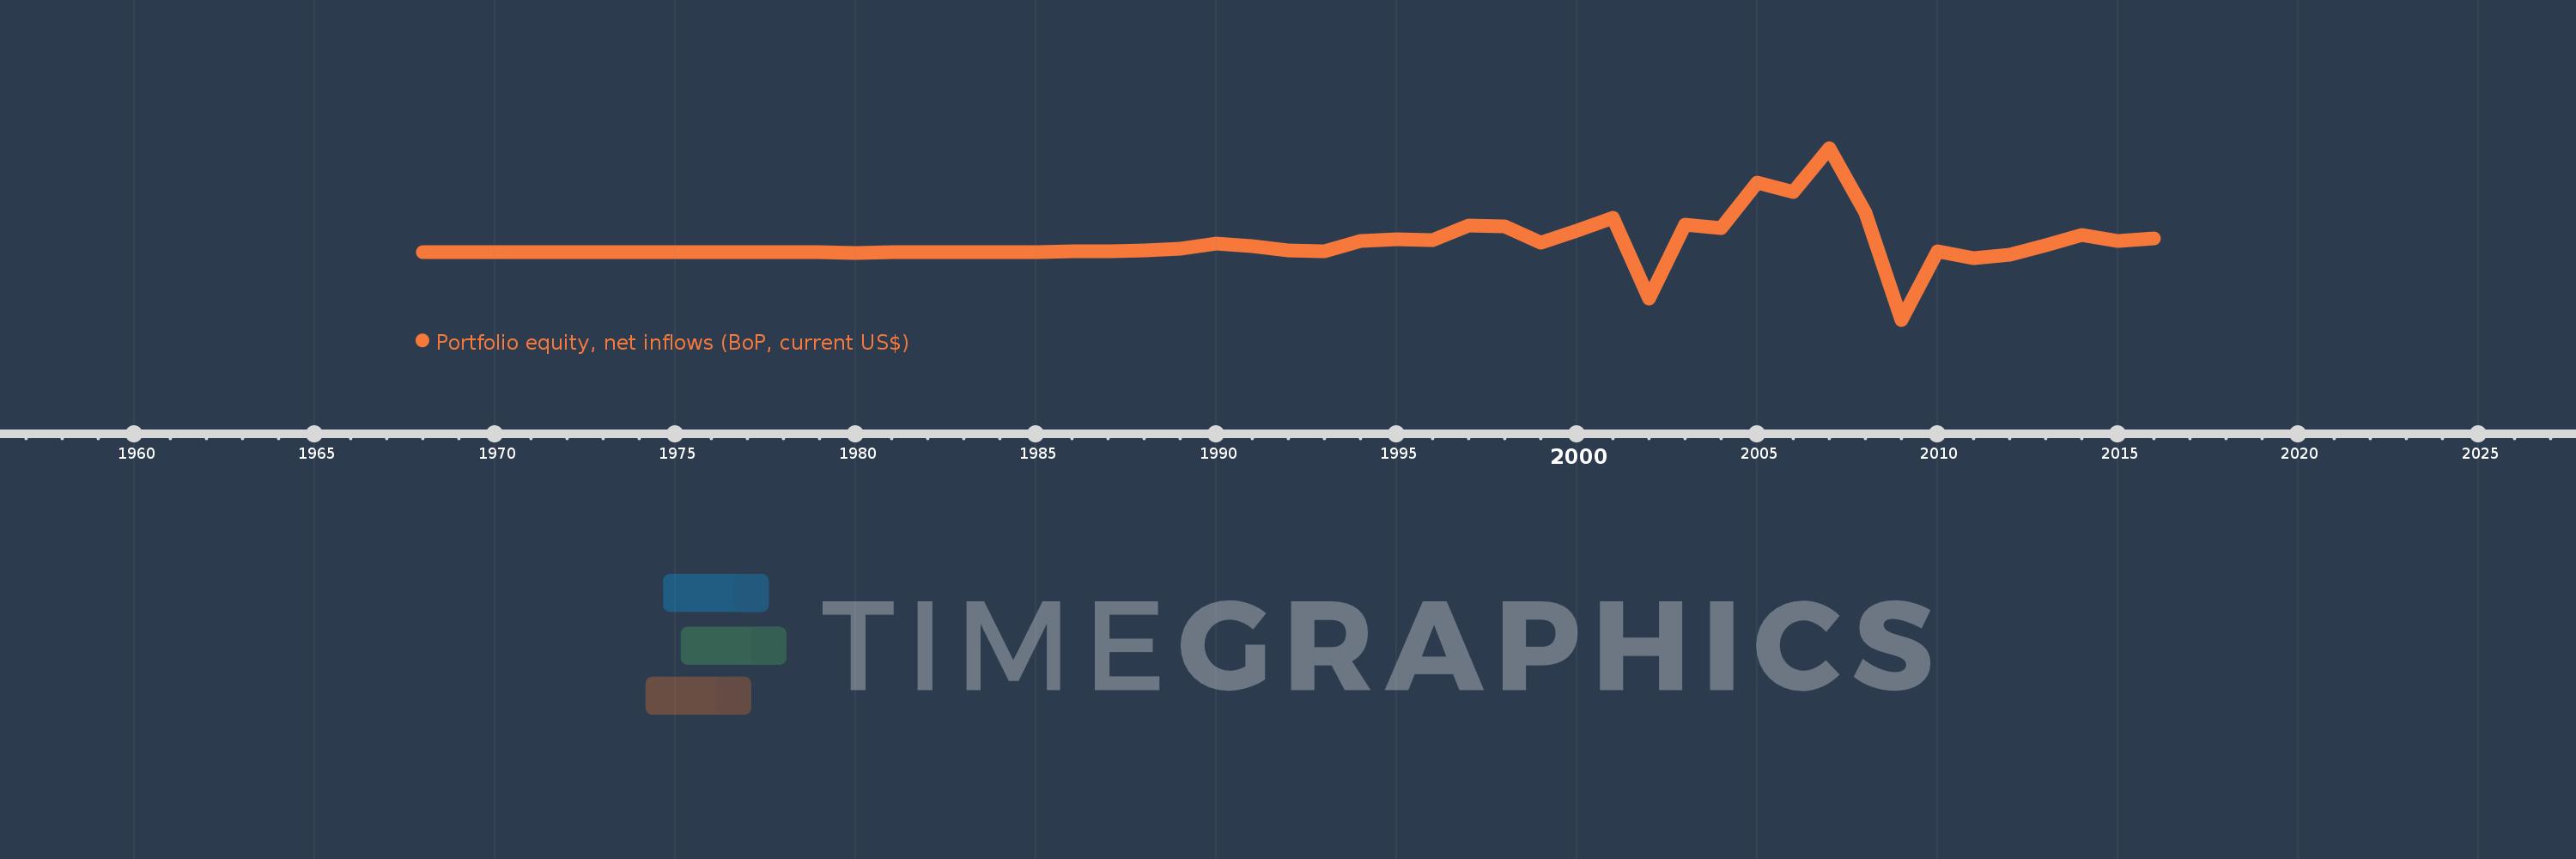
Portfolio equity, net inflows (BoP, current US$)
2016,2015,2014,2013,2012,2011,2010,2009,2008,2007,2006,2005,2004,2003,2002,2001,2000,1999,1998,1997,1996,1995,1994,1993,1992,1991,1990,1989,1988,1987,1986,1985,1984,1983,1982,1981,1980,1979,1978,1977,1976,1975,1974,1973,1972,1971,1970,1969,1968
Cette statistique dans les autres pays:
AfghanistanAlbaniaAlgeriaAngolaAntigua and BarbudaArab WorldArgentinaArmeniaArubaAustraliaAustriaAzerbaijanBahamas, TheBahrainBangladeshBarbadosBelarusBelgiumBelizeBeninBermudaBhutanBoliviaBosnia and HerzegovinaBotswanaBrazilBulgariaBurkina FasoBurundiCabo VerdeCambodiaCameroonCanadaCaribbean small statesCentral African RepublicCentral Europe and the BalticsChadChileChinaColombiaComorosCongo, Dem. Rep.Congo, Rep.Costa RicaCote d'IvoireCroatiaCuracaoCyprusCzech RepublicDenmarkDjiboutiDominicaDominican RepublicEarly-demographic dividendEast Asia & PacificEast Asia & Pacific (excluding high income)East Asia & Pacific (IDA & IBRD countries)EcuadorEgypt, Arab Rep.El SalvadorEquatorial GuineaEstoniaEthiopiaEuro areaEurope & Central AsiaEurope & Central Asia (excluding high income)Europe & Central Asia (IDA & IBRD countries)European UnionFijiFinlandFragile and conflict affected situationsFranceFrench PolynesiaGabonGambia, TheGeorgiaGermanyGhanaGreeceGrenadaGuatemalaGuineaGuinea-BissauGuyanaHaitiHeavily indebted poor countries (HIPC)High incomeHondurasHong Kong SAR, ChinaHungaryIBRD onlyIcelandIDA & IBRD totalIDA blendIDA onlyIDA totalIndiaIndonesiaIran, Islamic Rep.IraqIrelandIsraelItalyJamaicaJapanJordanKazakhstanKenyaKiribatiKorea, Rep.KosovoKuwaitKyrgyz RepublicLao PDRLate-demographic dividendLatin America & Caribbean Latin America & Caribbean (excluding high income)Latin America & the Caribbean (IDA & IBRD countries)LatviaLeast developed countries: UN classificationLebanonLesothoLiberiaLibyaLithuaniaLow & middle incomeLow incomeLower middle incomeLuxembourgMacao SAR, ChinaMacedonia, FYRMadagascarMalawiMalaysiaMaldivesMaliMaltaMarshall IslandsMauritaniaMauritiusMexicoMiddle East & North AfricaMiddle East & North Africa (excluding high income)Middle East & North Africa (IDA & IBRD countries)Middle incomeMoldovaMongoliaMontenegroMoroccoMozambiqueMyanmarNamibiaNepalNetherlandsNew CaledoniaNew ZealandNicaraguaNigerNigeriaNorth AmericaNorwayOECD membersOmanOther small statesPacific island small statesPakistanPanamaPapua New GuineaParaguayPeruPhilippinesPolandPortugalPost-demographic dividendPre-demographic dividendQatarRomaniaRussian FederationRwandaSamoaSao Tome and PrincipeSaudi ArabiaSenegalSerbiaSeychellesSierra LeoneSingaporeSlovak RepublicSloveniaSmall statesSolomon IslandsSomaliaSouth AfricaSouth AsiaSouth Asia (IDA & IBRD)SpainSri LankaSt. Kitts and NevisSt. LuciaSt. Vincent and the GrenadinesSub-Saharan Africa Sub-Saharan Africa (excluding high income)Sub-Saharan Africa (IDA & IBRD countries)SudanSurinameSwazilandSwedenSwitzerlandSyrian Arab RepublicTajikistanTanzaniaThailandTimor-LesteTogoTongaTrinidad and TobagoTunisiaTurkeyUgandaUkraineUnited KingdomUnited StatesUpper middle incomeUruguayVanuatuVenezuela, RBVietnamWest Bank and GazaWorldYemen, Rep.ZambiaZimbabwe La ligne de temps
Cette échelle de temps montre un graphique de 1968 année à 2016 année Austria. Les données jusqu'à 1967 année ne sont pas présentés. Quantité d'observations actuelles selon dates: 49.
Source (désignation):
Les indicateurs du développement mondiale
Source (organisation):
International Monetary Fund, Balance of Payments database, and World Bank, International Debt Statistics.
Catégories:
Economy & Growth, Financial Sector, External Debt
Dernière mise à jour
23 avr. 2017
Les indicateurs de changement de valeurs selon les années
Minimum:
-6.656 mds
1 janv. 2009
Maximum:
10.358 mds
1 janv. 2007
Pour la date d''observation
Valeur
Changement absolu
Le changement par rapport à la valeur précédente
1 janv. 1968
7.308 mln.
+7.308 mln.
0.0%
1 janv. 1969
461.538 milles
-6.846 mln.
-93.68%
1 janv. 1970
-115.385 milles
-576.923 milles
-125.0%
1 janv. 1971
807.692 milles
+923.077 milles
-800.0%
1 janv. 1972
3.523 mln.
+2.715 mln.
336.12%
1 janv. 1973
5.762 mln.
+2.24 mln.
63.58%
1 janv. 1974
-201.599 milles
-5.964 mln.
-103.5%
1 janv. 1975
-1.376 mln.
-1.174 mln.
582.36%
1 janv. 1976
4.928 mln.
+6.303 mln.
-458.21%
1 janv. 1977
2.286 mln.
-2.641 mln.
-53.6%
1 janv. 1978
-2.525 mln.
-4.812 mln.
-210.46%
1 janv. 1979
4.069 mln.
+6.594 mln.
-261.1%
1 janv. 1980
-14.29 mln.
-18.358 mln.
-451.23%
1 janv. 1981
9.74 mln.
+24.03 mln.
-168.16%
1 janv. 1982
-1.414 mln.
-11.154 mln.
-114.52%
1 janv. 1983
4.939 mln.
+6.353 mln.
-449.26%
1 janv. 1984
7.546 mln.
+2.607 mln.
52.79%
1 janv. 1985
2.561 mln.
-4.985 mln.
-66.06%
1 janv. 1986
107.407 mln.
+104.845 mln.
4.09 milles%
1 janv. 1987
103.627 mln.
-3.78 mln.
-3.52%
1 janv. 1988
239.619 mln.
+135.992 mln.
131.23%
1 janv. 1989
388.526 mln.
+148.907 mln.
62.14%
1 janv. 1990
864.226 mln.
+475.7 mln.
122.44%
1 janv. 1991
667.635 mln.
-196.591 mln.
-22.75%
1 janv. 1992
185.912 mln.
-481.722 mln.
-72.15%
1 janv. 1993
157.711 mln.
-28.201 mln.
-15.17%
1 janv. 1994
1.182 mds
+1.025 mds
649.77%
1 janv. 1995
1.304 mds
+121.508 mln.
10.28%
1 janv. 1996
1.265 mds
-38.9 mln.
-2.98%
1 janv. 1997
2.653 mds
+1.388 mds
109.73%
1 janv. 1998
2.609 mds
-44.231 mln.
-1.67%
1 janv. 1999
992.792 mln.
-1.616 mds
-61.95%
1 janv. 2000
2.13 mds
+1.138 mds
114.59%
1 janv. 2001
3.436 mds
+1.306 mds
61.28%
1 janv. 2002
-4.538 mds
-7.974 mds
-232.07%
1 janv. 2003
2.772 mds
+7.31 mds
-161.09%
1 janv. 2004
2.431 mds
-341.242 mln.
-12.31%
1 janv. 2005
6.926 mds
+4.495 mds
184.94%
1 janv. 2006
5.999 mds
-927.295 mln.
-13.39%
1 janv. 2007
10.358 mds
+4.359 mds
72.66%
1 janv. 2008
3.941 mds
-6.416 mds
-61.95%
1 janv. 2009
-6.656 mds
-10.597 mds
-268.87%
1 janv. 2010
149.928 mln.
+6.806 mds
-102.25%
1 janv. 2011
-539.014 mln.
-688.943 mln.
-459.51%
1 janv. 2012
-225.797 mln.
+313.218 mln.
-58.11%
1 janv. 2013
730.255 mln.
+956.051 mln.
-423.41%
1 janv. 2014
1.768 mds
+1.038 mds
142.07%
1 janv. 2015
1.123 mds
-644.958 mln.
-36.48%
1 janv. 2016
1.376 mds
+253.228 mln.
22.55%
Classement des pays selon les statistiques actuelles par années


Commentaires: