29
/fr/
fr
AIzaSyAYiBZKx7MnpbEhh9jyipgxe19OcubqV5w
April 1, 2024
55814
Pre-demographic dividend
PRE
false
2
1
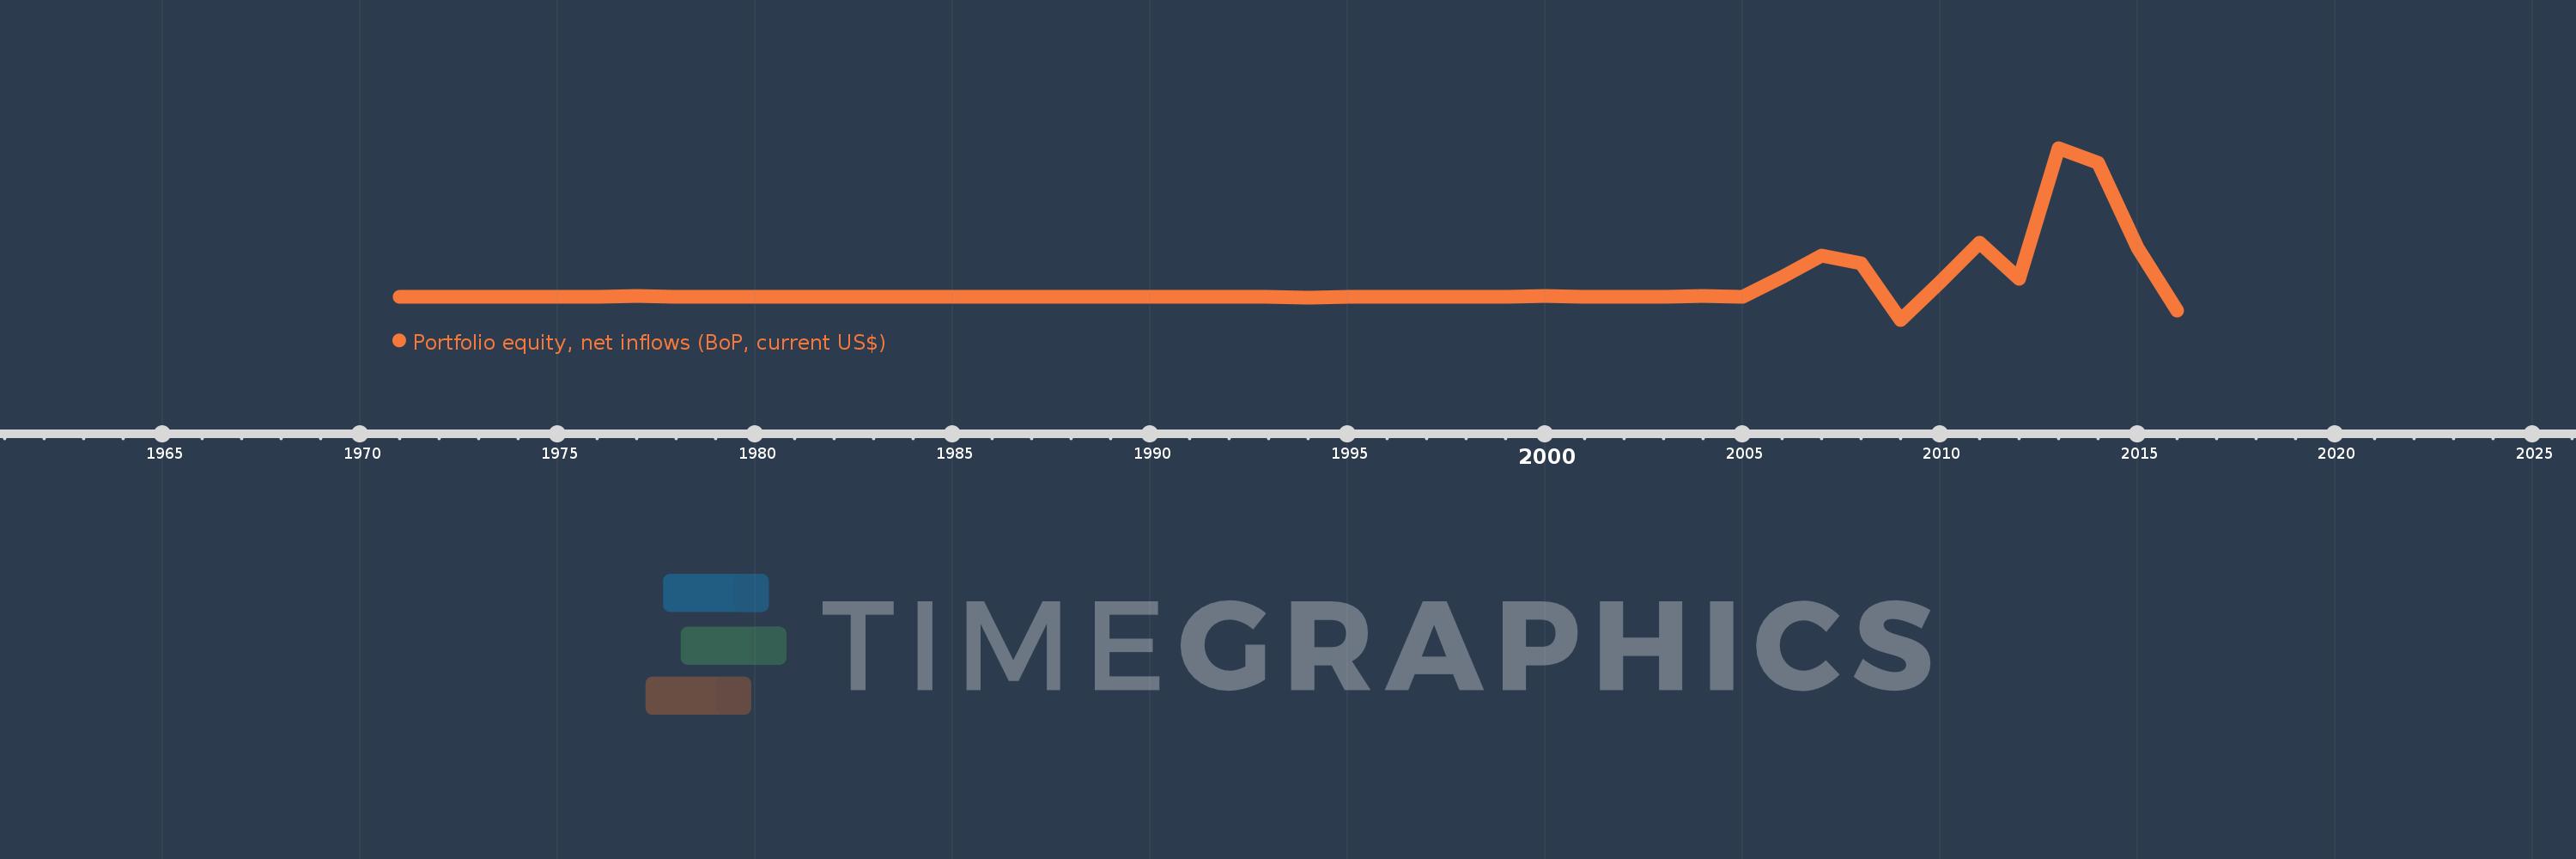
Portfolio equity, net inflows (BoP, current US$)
2016,2015,2014,2013,2012,2011,2010,2009,2008,2007,2006,2005,2004,2003,2002,2001,2000,1999,1998,1997,1996,1995,1994,1993,1992,1991,1990,1989,1988,1987,1986,1985,1984,1983,1982,1981,1980,1979,1978,1977,1976,1975,1974,1973,1972,1971
Cette statistique dans les autres pays:
AfghanistanAlbaniaAlgeriaAngolaAntigua and BarbudaArab WorldArgentinaArmeniaArubaAustraliaAustriaAzerbaijanBahamas, TheBahrainBangladeshBarbadosBelarusBelgiumBelizeBeninBermudaBhutanBoliviaBosnia and HerzegovinaBotswanaBrazilBulgariaBurkina FasoBurundiCabo VerdeCambodiaCameroonCanadaCaribbean small statesCentral African RepublicCentral Europe and the BalticsChadChileChinaColombiaComorosCongo, Dem. Rep.Congo, Rep.Costa RicaCote d'IvoireCroatiaCuracaoCyprusCzech RepublicDenmarkDjiboutiDominicaDominican RepublicEarly-demographic dividendEast Asia & PacificEast Asia & Pacific (excluding high income)East Asia & Pacific (IDA & IBRD countries)EcuadorEgypt, Arab Rep.El SalvadorEquatorial GuineaEstoniaEthiopiaEuro areaEurope & Central AsiaEurope & Central Asia (excluding high income)Europe & Central Asia (IDA & IBRD countries)European UnionFijiFinlandFragile and conflict affected situationsFranceFrench PolynesiaGabonGambia, TheGeorgiaGermanyGhanaGreeceGrenadaGuatemalaGuineaGuinea-BissauGuyanaHaitiHeavily indebted poor countries (HIPC)High incomeHondurasHong Kong SAR, ChinaHungaryIBRD onlyIcelandIDA & IBRD totalIDA blendIDA onlyIDA totalIndiaIndonesiaIran, Islamic Rep.IraqIrelandIsraelItalyJamaicaJapanJordanKazakhstanKenyaKiribatiKorea, Rep.KosovoKuwaitKyrgyz RepublicLao PDRLate-demographic dividendLatin America & Caribbean Latin America & Caribbean (excluding high income)Latin America & the Caribbean (IDA & IBRD countries)LatviaLeast developed countries: UN classificationLebanonLesothoLiberiaLibyaLithuaniaLow & middle incomeLow incomeLower middle incomeLuxembourgMacao SAR, ChinaMacedonia, FYRMadagascarMalawiMalaysiaMaldivesMaliMaltaMarshall IslandsMauritaniaMauritiusMexicoMiddle East & North AfricaMiddle East & North Africa (excluding high income)Middle East & North Africa (IDA & IBRD countries)Middle incomeMoldovaMongoliaMontenegroMoroccoMozambiqueMyanmarNamibiaNepalNetherlandsNew CaledoniaNew ZealandNicaraguaNigerNigeriaNorth AmericaNorwayOECD membersOmanOther small statesPacific island small statesPakistanPanamaPapua New GuineaParaguayPeruPhilippinesPolandPortugalPost-demographic dividendPre-demographic dividendQatarRomaniaRussian FederationRwandaSamoaSao Tome and PrincipeSaudi ArabiaSenegalSerbiaSeychellesSierra LeoneSingaporeSlovak RepublicSloveniaSmall statesSolomon IslandsSomaliaSouth AfricaSouth AsiaSouth Asia (IDA & IBRD)SpainSri LankaSt. Kitts and NevisSt. LuciaSt. Vincent and the GrenadinesSub-Saharan Africa Sub-Saharan Africa (excluding high income)Sub-Saharan Africa (IDA & IBRD countries)SudanSurinameSwazilandSwedenSwitzerlandSyrian Arab RepublicTajikistanTanzaniaThailandTimor-LesteTogoTongaTrinidad and TobagoTunisiaTurkeyUgandaUkraineUnited KingdomUnited StatesUpper middle incomeUruguayVanuatuVenezuela, RBVietnamWest Bank and GazaWorldYemen, Rep.ZambiaZimbabwe La ligne de temps
Cette échelle de temps montre un graphique de 1971 année à 2016 année Pre-demographic dividend. Les données jusqu'à 1970 année ne sont pas présentés. Quantité d'observations actuelles selon dates: 46.
Source (désignation):
Les indicateurs du développement mondiale
Source (organisation):
International Monetary Fund, Balance of Payments database, and World Bank, International Debt Statistics.
Catégories:
Economy & Growth, Financial Sector, External Debt
Dernière mise à jour
23 avr. 2017
Les indicateurs de changement de valeurs selon les années
Minimum:
-955.935 mln.
1 janv. 2009
Maximum:
6.338 mds
1 janv. 2013
Pour la date d''observation
Valeur
Changement absolu
Le changement par rapport à la valeur précédente
1 janv. 1975
3.756 mln.
+3.756 mln.
%
1 janv. 1976
5.377 mln.
+1.621 mln.
43.17%
1 janv. 1977
36.81 mln.
+31.433 mln.
584.58%
1 janv. 1978
4.555 mln.
-32.255 mln.
-87.63%
1 janv. 1979
26.179 mln.
+21.624 mln.
474.72%
1 janv. 1980
22.333 mln.
-3.847 mln.
-14.69%
1 janv. 1981
3.597 mln.
-18.735 mln.
-83.89%
1 janv. 1982
2.524 mln.
-1.073 mln.
-29.82%
1 janv. 1983
4.351 mln.
+1.826 mln.
72.34%
1 janv. 1984
412.497 milles
-3.938 mln.
-90.52%
1 janv. 1985
2.236 mln.
+1.823 mln.
441.95%
1 janv. 1986
850.138 milles
-1.385 mln.
-61.97%
1 janv. 1987
2.722 mln.
+1.872 mln.
220.16%
1 janv. 1988
5.691 mln.
+2.969 mln.
109.09%
1 janv. 1989
2.989 mln.
-2.702 mln.
-47.48%
1 janv. 1990
3.143 mln.
+154.64 milles
5.17%
1 janv. 1991
6.54 mln.
+3.396 mln.
108.04%
1 janv. 1992
2.453 mln.
-4.087 mln.
-62.49%
1 janv. 1993
868.935 milles
-1.584 mln.
-64.58%
1 janv. 1994
-1.79 mln.
-2.659 mln.
-306.04%
1 janv. 1995
4.865 mln.
+6.656 mln.
-371.76%
1 janv. 1996
10.163 mln.
+5.298 mln.
108.9%
1 janv. 1997
32.471 mln.
+22.308 mln.
219.49%
1 janv. 1998
35.997 mln.
+3.526 mln.
10.86%
1 janv. 1999
21.875 mln.
-14.122 mln.
-39.23%
1 janv. 2000
47.24 mln.
+25.365 mln.
115.95%
1 janv. 2001
2.938 mln.
-44.302 mln.
-93.78%
1 janv. 2002
33.365 mln.
+30.427 mln.
1.04 milles%
1 janv. 2003
20.89 mln.
-12.475 mln.
-37.39%
1 janv. 2004
38.04 mln.
+17.149 mln.
82.09%
1 janv. 2005
7.521 mln.
-30.519 mln.
-80.23%
1 janv. 2006
863.345 mln.
+855.824 mln.
11.38 milles%
1 janv. 2007
1.769 mds
+906.059 mln.
104.95%
1 janv. 2008
1.429 mds
-340.43 mln.
-19.24%
1 janv. 2009
-955.935 mln.
-2.385 mds
-166.9%
1 janv. 2010
636.365 mln.
+1.592 mds
-166.57%
1 janv. 2011
2.321 mds
+1.685 mds
264.75%
1 janv. 2012
777.502 mln.
-1.544 mds
-66.5%
1 janv. 2013
6.338 mds
+5.561 mds
715.18%
1 janv. 2014
5.707 mds
-631.501 mln.
-9.96%
1 janv. 2015
2.081 mds
-3.625 mds
-63.53%
1 janv. 2016
-576.154 mln.
-2.657 mds
-127.69%
Classement des pays selon les statistiques actuelles par années


Commentaires: