29
/fr/
fr
AIzaSyAYiBZKx7MnpbEhh9jyipgxe19OcubqV5w
April 1, 2024
73355
Australia
AUS
true
2
1
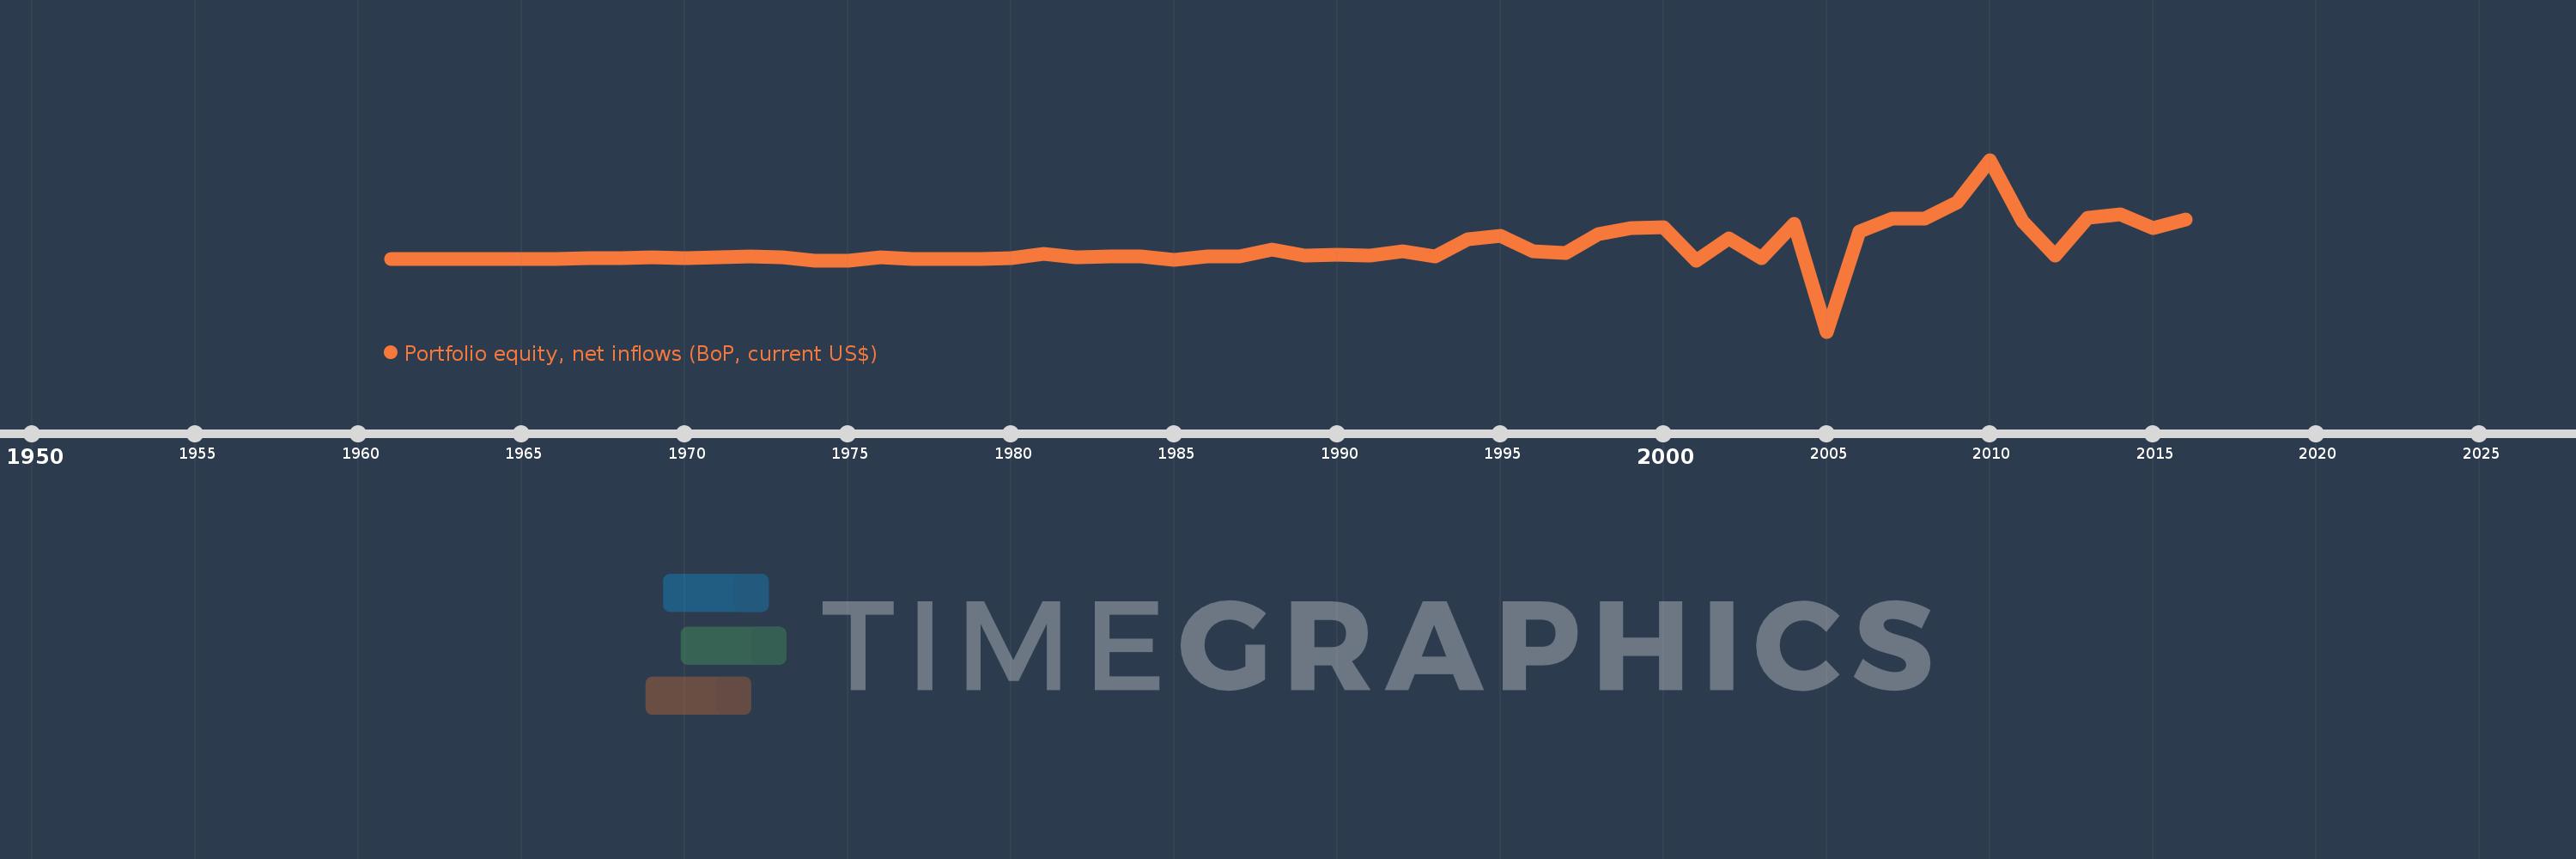
Portfolio equity, net inflows (BoP, current US$)
2016,2015,2014,2013,2012,2011,2010,2009,2008,2007,2006,2005,2004,2003,2002,2001,2000,1999,1998,1997,1996,1995,1994,1993,1992,1991,1990,1989,1988,1987,1986,1985,1984,1983,1982,1981,1980,1979,1978,1977,1976,1975,1974,1973,1972,1971,1970,1969,1968,1967,1966,1965,1964,1963,1962,1961
Cette statistique dans les autres pays:
AfghanistanAlbaniaAlgeriaAngolaAntigua and BarbudaArab WorldArgentinaArmeniaArubaAustraliaAustriaAzerbaijanBahamas, TheBahrainBangladeshBarbadosBelarusBelgiumBelizeBeninBermudaBhutanBoliviaBosnia and HerzegovinaBotswanaBrazilBulgariaBurkina FasoBurundiCabo VerdeCambodiaCameroonCanadaCaribbean small statesCentral African RepublicCentral Europe and the BalticsChadChileChinaColombiaComorosCongo, Dem. Rep.Congo, Rep.Costa RicaCote d'IvoireCroatiaCuracaoCyprusCzech RepublicDenmarkDjiboutiDominicaDominican RepublicEarly-demographic dividendEast Asia & PacificEast Asia & Pacific (excluding high income)East Asia & Pacific (IDA & IBRD countries)EcuadorEgypt, Arab Rep.El SalvadorEquatorial GuineaEstoniaEthiopiaEuro areaEurope & Central AsiaEurope & Central Asia (excluding high income)Europe & Central Asia (IDA & IBRD countries)European UnionFijiFinlandFragile and conflict affected situationsFranceFrench PolynesiaGabonGambia, TheGeorgiaGermanyGhanaGreeceGrenadaGuatemalaGuineaGuinea-BissauGuyanaHaitiHeavily indebted poor countries (HIPC)High incomeHondurasHong Kong SAR, ChinaHungaryIBRD onlyIcelandIDA & IBRD totalIDA blendIDA onlyIDA totalIndiaIndonesiaIran, Islamic Rep.IraqIrelandIsraelItalyJamaicaJapanJordanKazakhstanKenyaKiribatiKorea, Rep.KosovoKuwaitKyrgyz RepublicLao PDRLate-demographic dividendLatin America & Caribbean Latin America & Caribbean (excluding high income)Latin America & the Caribbean (IDA & IBRD countries)LatviaLeast developed countries: UN classificationLebanonLesothoLiberiaLibyaLithuaniaLow & middle incomeLow incomeLower middle incomeLuxembourgMacao SAR, ChinaMacedonia, FYRMadagascarMalawiMalaysiaMaldivesMaliMaltaMarshall IslandsMauritaniaMauritiusMexicoMiddle East & North AfricaMiddle East & North Africa (excluding high income)Middle East & North Africa (IDA & IBRD countries)Middle incomeMoldovaMongoliaMontenegroMoroccoMozambiqueMyanmarNamibiaNepalNetherlandsNew CaledoniaNew ZealandNicaraguaNigerNigeriaNorth AmericaNorwayOECD membersOmanOther small statesPacific island small statesPakistanPanamaPapua New GuineaParaguayPeruPhilippinesPolandPortugalPost-demographic dividendPre-demographic dividendQatarRomaniaRussian FederationRwandaSamoaSao Tome and PrincipeSaudi ArabiaSenegalSerbiaSeychellesSierra LeoneSingaporeSlovak RepublicSloveniaSmall statesSolomon IslandsSomaliaSouth AfricaSouth AsiaSouth Asia (IDA & IBRD)SpainSri LankaSt. Kitts and NevisSt. LuciaSt. Vincent and the GrenadinesSub-Saharan Africa Sub-Saharan Africa (excluding high income)Sub-Saharan Africa (IDA & IBRD countries)SudanSurinameSwazilandSwedenSwitzerlandSyrian Arab RepublicTajikistanTanzaniaThailandTimor-LesteTogoTongaTrinidad and TobagoTunisiaTurkeyUgandaUkraineUnited KingdomUnited StatesUpper middle incomeUruguayVanuatuVenezuela, RBVietnamWest Bank and GazaWorldYemen, Rep.ZambiaZimbabwe La ligne de temps
Cette échelle de temps montre un graphique de 1961 année à 2016 année Australia. Les données jusqu'à 1960 année ne sont pas présentés. Quantité d'observations actuelles selon dates: 56.
Source (désignation):
Les indicateurs du développement mondiale
Source (organisation):
International Monetary Fund, Balance of Payments database, and World Bank, International Debt Statistics.
Catégories:
Economy & Growth, Financial Sector, External Debt
Dernière mise à jour
23 avr. 2017
Les indicateurs de changement de valeurs selon les années
Minimum:
-25.221 mds
1 janv. 2005
Maximum:
34.461 mds
1 janv. 2010
Pour la date d''observation
Valeur
Changement absolu
Le changement par rapport à la valeur précédente
1 janv. 1961
91.84 mln.
+91.84 mln.
0.0%
1 janv. 1962
98.56 mln.
+6.72 mln.
7.32%
1 janv. 1963
88.48 mln.
-10.08 mln.
-10.23%
1 janv. 1964
62.72 mln.
-25.76 mln.
-29.11%
1 janv. 1965
40.32 mln.
-22.4 mln.
-35.71%
1 janv. 1966
125.44 mln.
+85.12 mln.
211.11%
1 janv. 1967
188.16 mln.
+62.72 mln.
50.0%
1 janv. 1968
310.24 mln.
+122.08 mln.
64.88%
1 janv. 1969
473.76 mln.
+163.52 mln.
52.71%
1 janv. 1970
334.88 mln.
-138.88 mln.
-29.31%
1 janv. 1971
464.8 mln.
+129.92 mln.
38.8%
1 janv. 1972
843.229 mln.
+378.429 mln.
81.42%
1 janv. 1973
716.767 mln.
-126.463 mln.
-15.0%
1 janv. 1974
-516.304 mln.
-1.233 mds
-172.03%
1 janv. 1975
-549.325 mln.
-33.021 mln.
6.4%
1 janv. 1976
474.655 mln.
+1.024 mds
-186.41%
1 janv. 1977
-114.498 mln.
-589.154 mln.
-124.12%
1 janv. 1978
-64.506 mln.
+49.993 mln.
-43.66%
1 janv. 1979
41.143 mln.
+105.649 mln.
-163.78%
1 janv. 1980
359.876 mln.
+318.732 mln.
774.69%
1 janv. 1981
1.78 mds
+1.42 mds
394.67%
1 janv. 1982
519.753 mln.
-1.26 mds
-70.8%
1 janv. 1983
781.63 mln.
+261.877 mln.
50.38%
1 janv. 1984
887.97 mln.
+106.34 mln.
13.6%
1 janv. 1985
-224.509 mln.
-1.112 mds
-125.28%
1 janv. 1986
963.869 mln.
+1.188 mds
-529.32%
1 janv. 1987
1.014 mds
+50.069 mln.
5.19%
1 janv. 1988
3.204 mds
+2.19 mds
215.97%
1 janv. 1989
1.107 mds
-2.096 mds
-65.44%
1 janv. 1990
1.401 mds
+293.773 mln.
26.53%
1 janv. 1991
1.275 mds
-126.086 mln.
-9.0%
1 janv. 1992
2.798 mds
+1.523 mds
119.45%
1 janv. 1993
797.611 mln.
-2.0 mds
-71.49%
1 janv. 1994
7.004 mds
+6.206 mds
778.08%
1 janv. 1995
8.12 mds
+1.117 mds
15.94%
1 janv. 1996
2.585 mds
-5.535 mds
-68.17%
1 janv. 1997
2.068 mds
-516.68 mln.
-19.99%
1 janv. 1998
8.775 mds
+6.706 mds
324.24%
1 janv. 1999
10.777 mds
+2.003 mds
22.82%
1 janv. 2000
11.06 mds
+282.945 mln.
2.63%
1 janv. 2001
-726.476 mln.
-11.786 mds
-106.57%
1 janv. 2002
7.159 mds
+7.885 mds
-1.09 milles%
1 janv. 2003
283.102 mln.
-6.876 mds
-96.05%
1 janv. 2004
12.209 mds
+11.926 mds
4.21 milles%
1 janv. 2005
-25.221 mds
-37.431 mds
-306.57%
1 janv. 2006
9.668 mds
+34.89 mds
-138.33%
1 janv. 2007
14.032 mds
+4.364 mds
45.14%
1 janv. 2008
14.097 mds
+64.444 mln.
0.46%
1 janv. 2009
19.795 mds
+5.698 mds
40.42%
1 janv. 2010
34.461 mds
+14.666 mds
74.09%
1 janv. 2011
13.15 mds
-21.312 mds
-61.84%
1 janv. 2012
1.308 mds
-11.842 mds
-90.05%
1 janv. 2013
14.325 mds
+13.017 mds
995.39%
1 janv. 2014
15.56 mds
+1.235 mds
8.62%
1 janv. 2015
10.767 mds
-4.793 mds
-30.8%
1 janv. 2016
13.846 mds
+3.079 mds
28.6%
Classement des pays selon les statistiques actuelles par années


Commentaires: